


Can Bulls Push Past $5,000 on the Back of Massive ETF Inflows?
TL;DR
- Ethereum now ranks 22nd globally by market cap, surpassing Mastercard and Netflix in valuation.
- Record $1.01 billion in Ether ETF inflows signals strong institutional demand for Ethereum exposure.
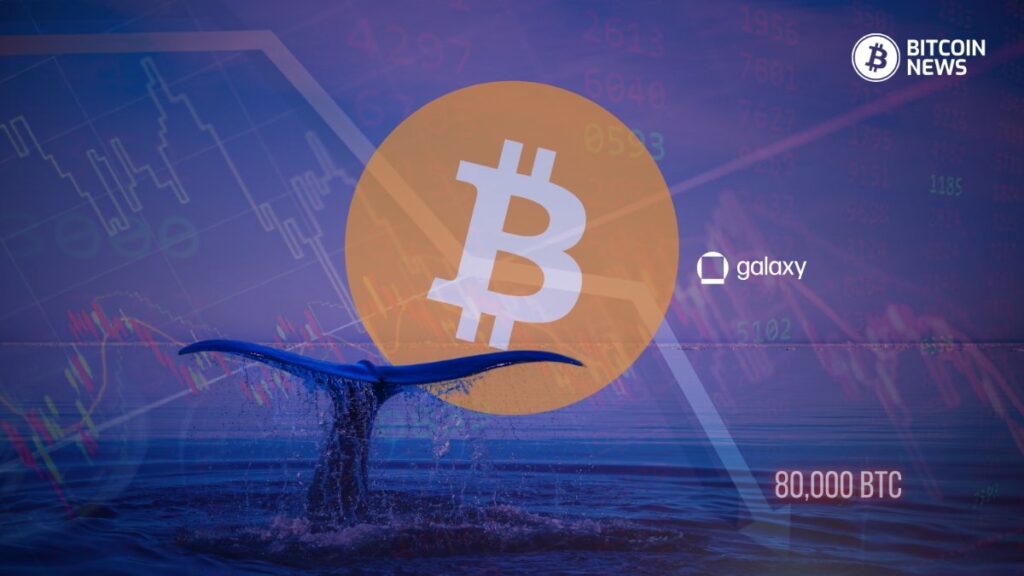
- Whale accumulates over 312,000 ETH worth $1.34 billion from top liquidity providers within eight days.
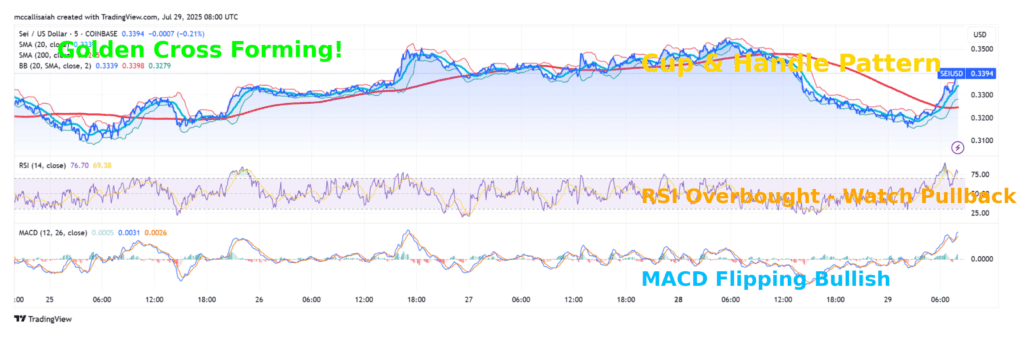
- RSI above 70 and price above Bollinger Band indicate strong momentum, but overbought conditions.
- Sustained $4,400 breakout could trigger short squeeze, pushing Ethereum toward $4,800–$5,000 price target.
Outlook and Ethereum Price Predictions
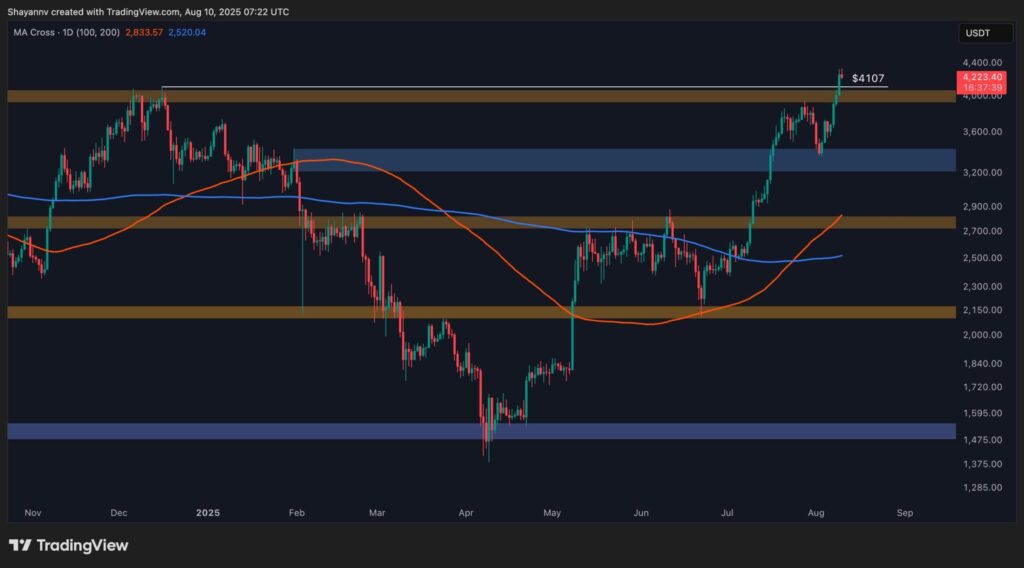
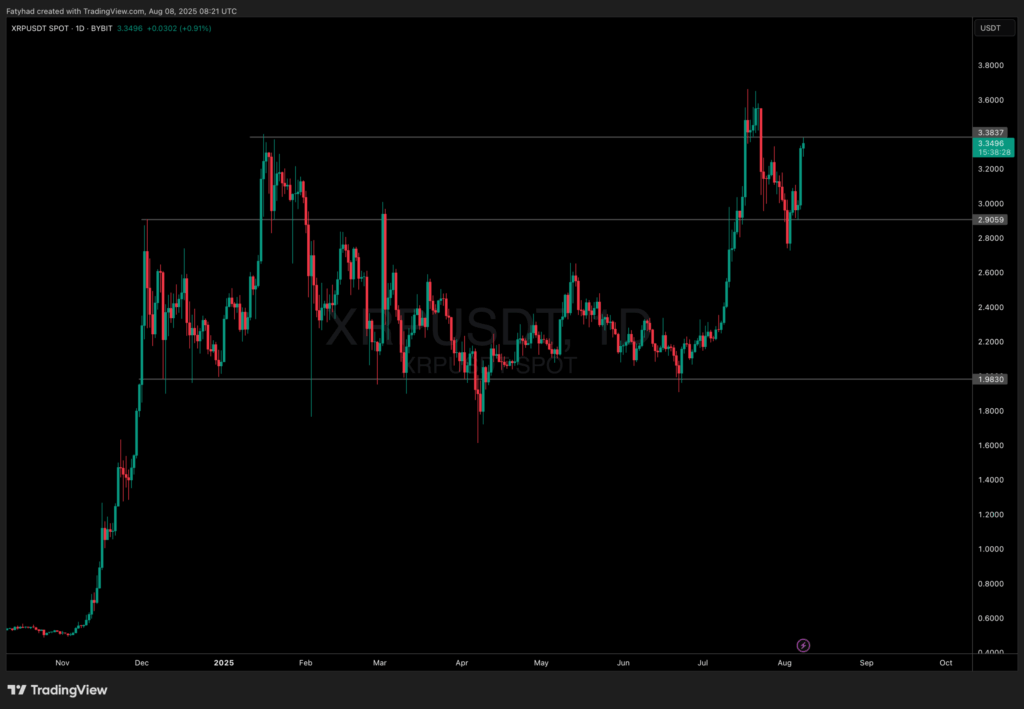
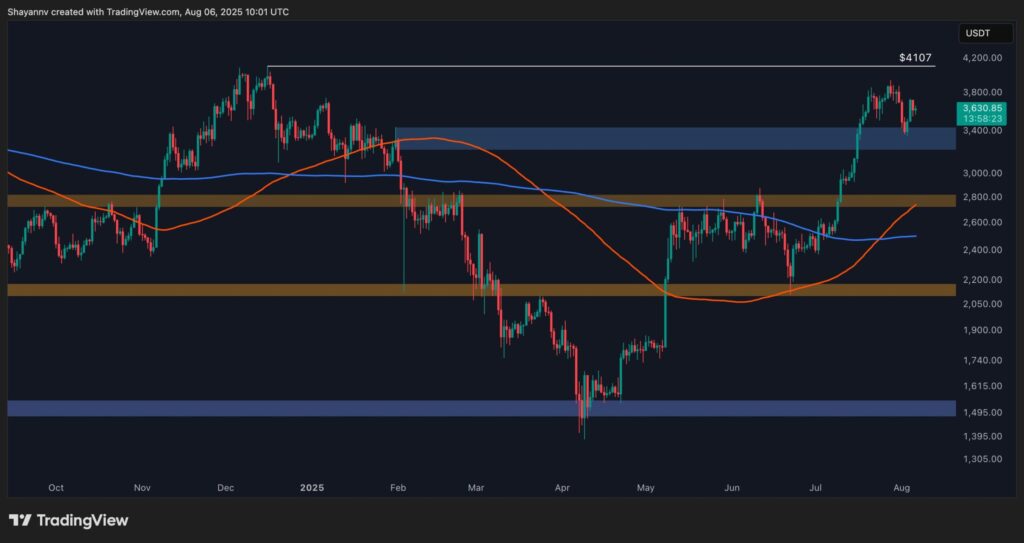
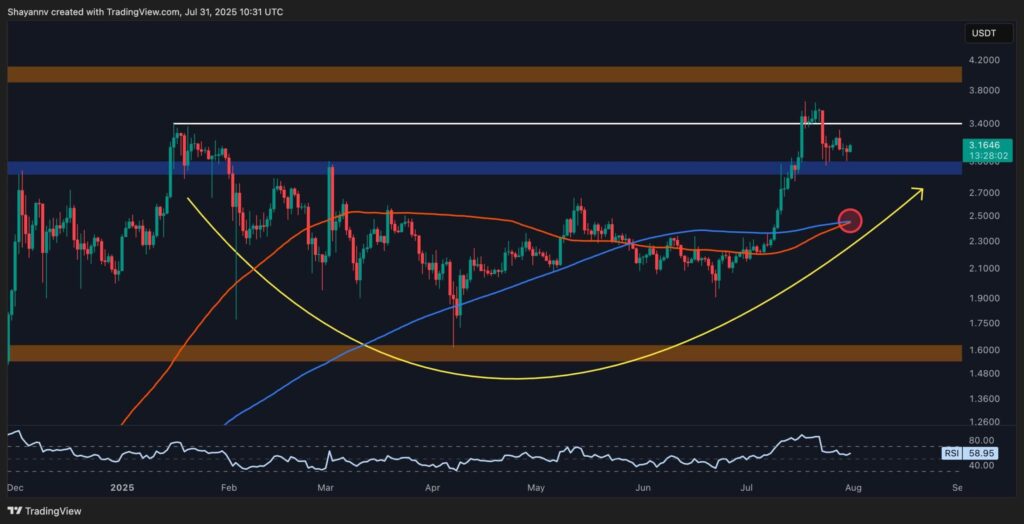
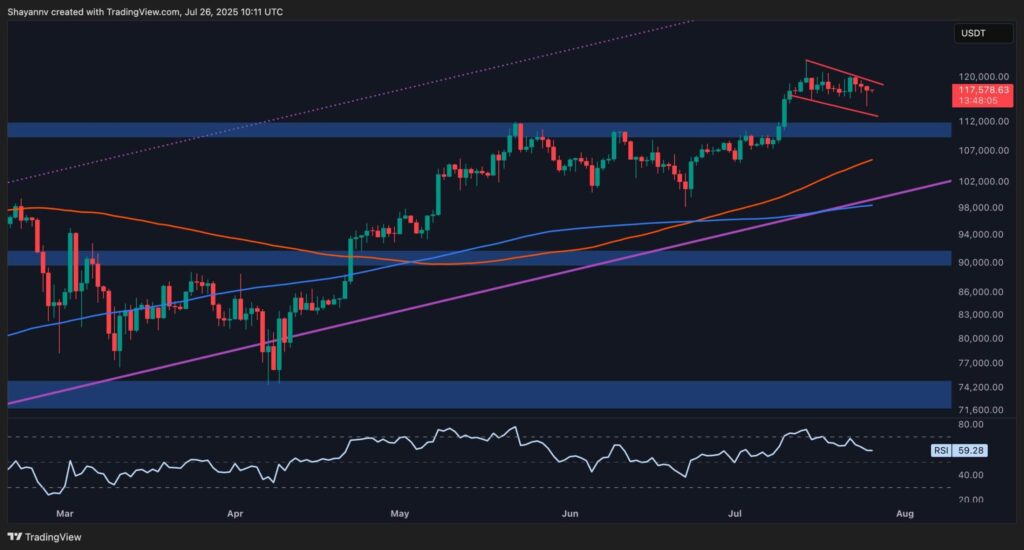
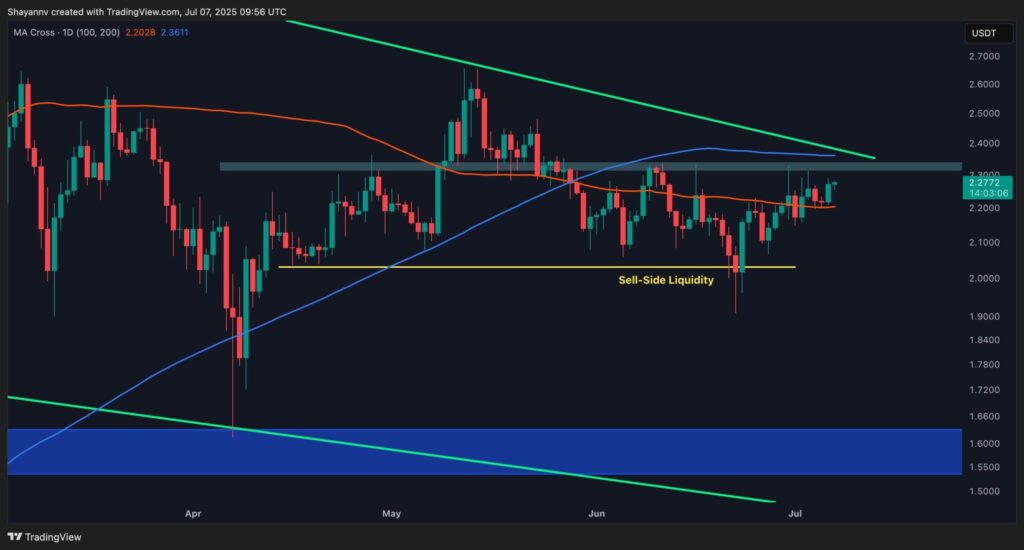
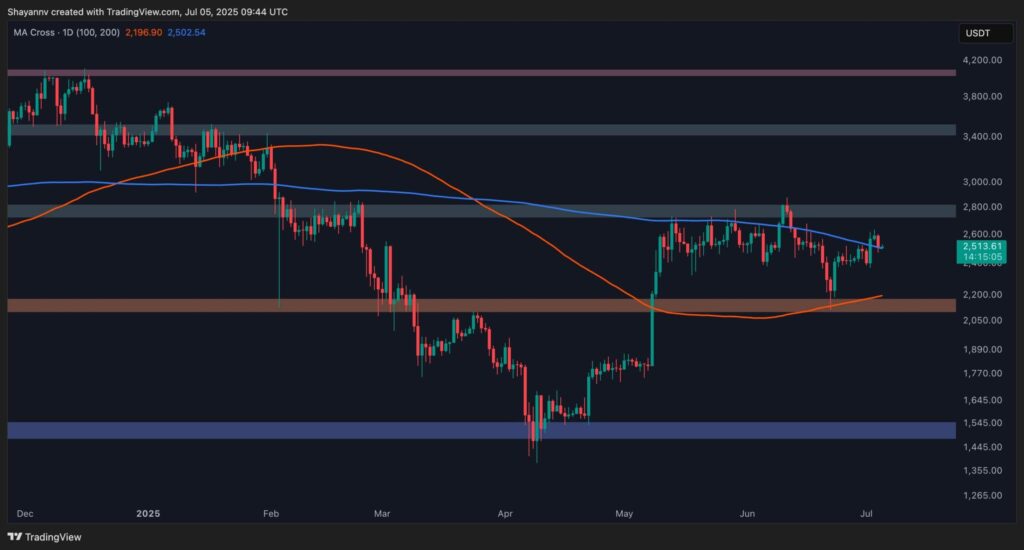
Immediate resistance is near $4,344, with a stronger barrier between $4,400 and $4,450. A close above these points could open the way toward $4,800–$5,000, in line with analyst estimates. Ali has also pointed to $5,210 and $6,946 as possible longer-term targets using pricing band models.
$5,210 and $6,946 are the next targets for Ethereum $ETH, according to the Pricing Bands. pic.twitter.com/hKJNn0RKYF
— Ali (@ali_charts) August 12, 2025
Support is in the $4,150–$4,200 range, with further support near $3,950 if a deeper pullback occurs. Heavy ETF inflows, corporate buying, and low exchange reserves are bullish factors, but overbought readings suggest short-term caution.
ETH is still 12% below its all-time high. Strong institutional buying and favorable on-chain data keep $5,000 in sight in the weeks ahead.
Market Performance and 24-Hour Outlook
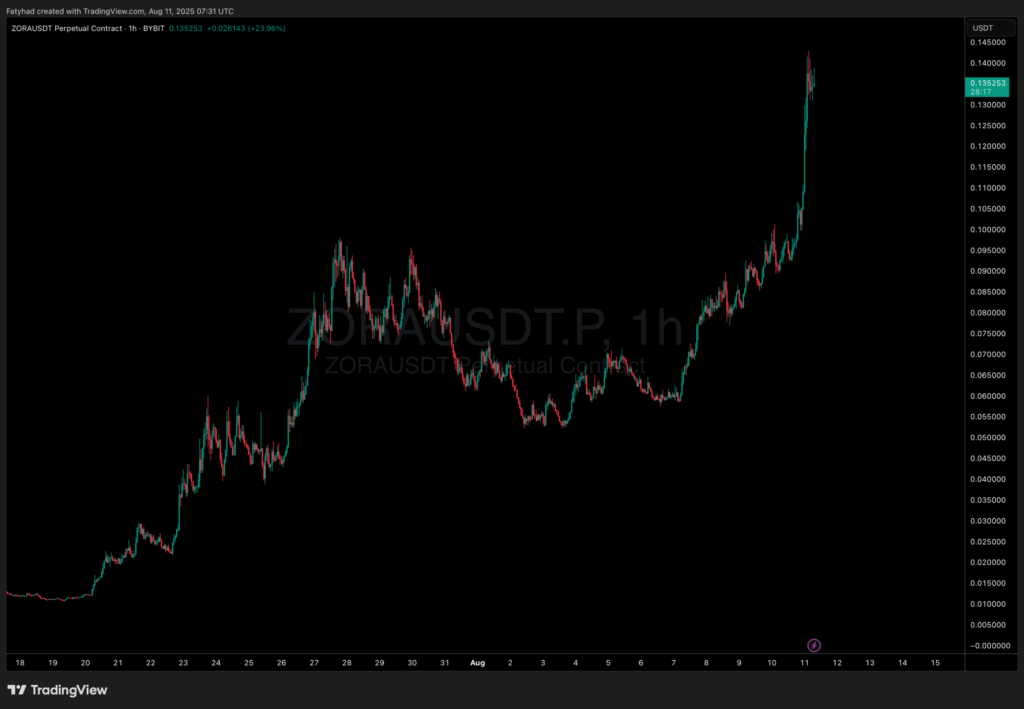
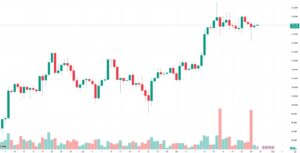
Ethereum (ETH) was trading at $4,300 at press time, with 24-hour trading volume of $39.2 billion. The price is up 0.03% in the past day and 17% over the past week.
In the last 24 hours, ETH traded between $4,170 and $4,347. Over the week, the range was $3,560 to $4,330.
ETH is currently about 12% below its all-time high of $4,878 from November 10, 2021. Recent trading sessions have been marked by strong volume and large inflows into spot Ether exchange-traded funds (ETFs).
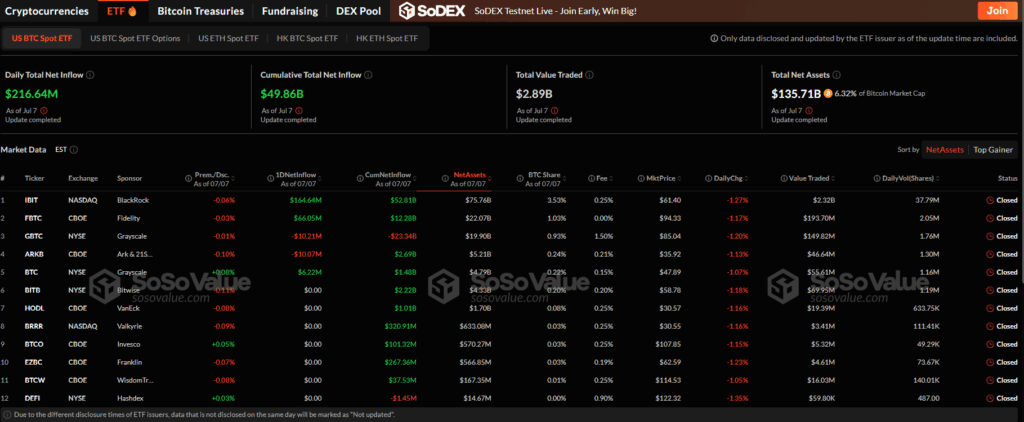
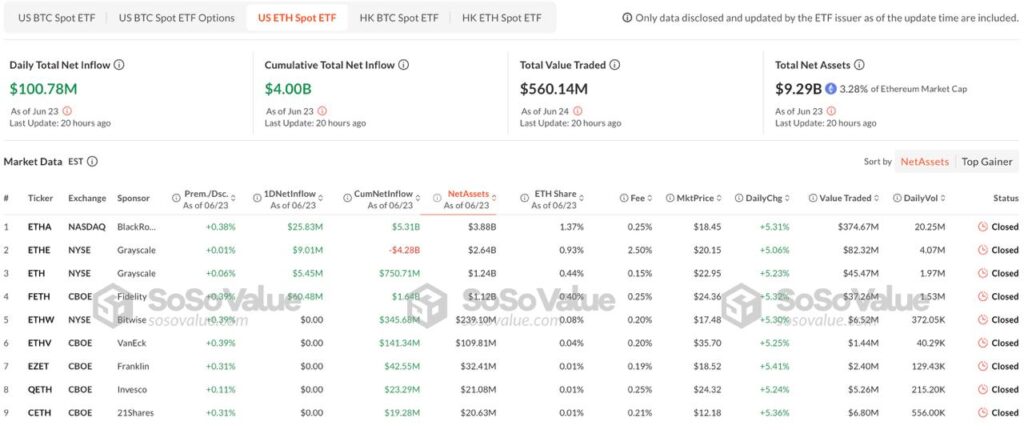
Monday recorded $1.01 billion in net inflows to these funds, the highest on record. BlackRock’s iShares Ethereum Trust ETF (ETHA) took in $640 million, and Fidelity’s Ethereum Fund (FETH) added $277 million.
Moreover, Ethereum now ranks 22nd among the world’s largest assets by market capitalization, ahead of Mastercard and Netflix. Reflecting its expanding role both in crypto and among traditional global assets, market analyst Rand noted,
“$ETH just surpassed Mastercard and Netflix on MarketCap valuation, taking the Global 22nd rank position.”
GM guys! $ETH just surpassed Mastercard and Netflix on MarketCap valuation, taking the Global 22nd rank position ⚡️ pic.twitter.com/p4bKLy4Ncb
— Rand (@crypto_rand) August 12, 2025
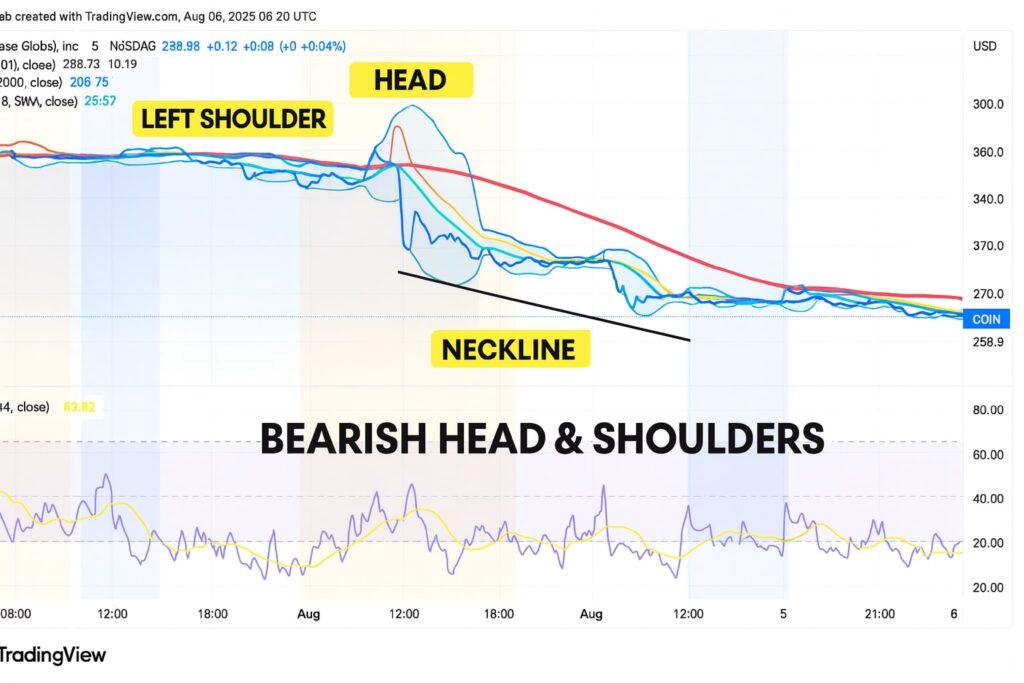
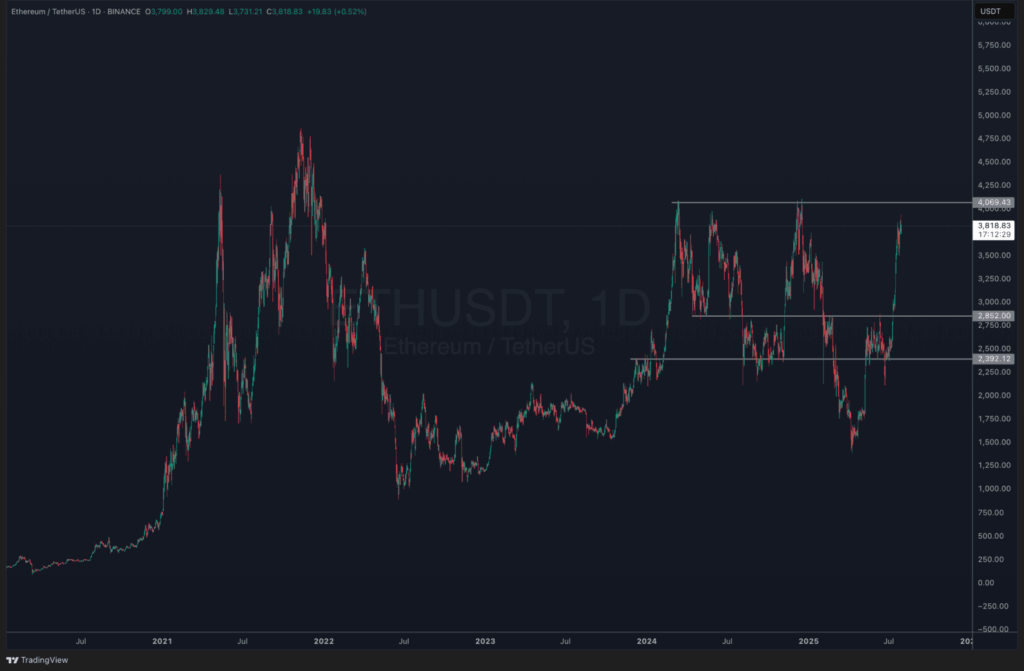
Technical Analysis
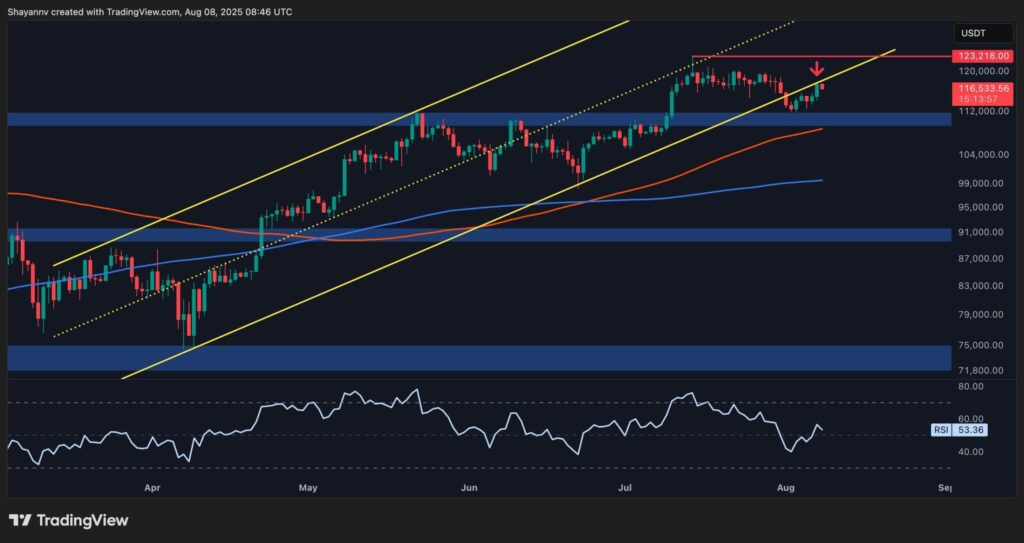
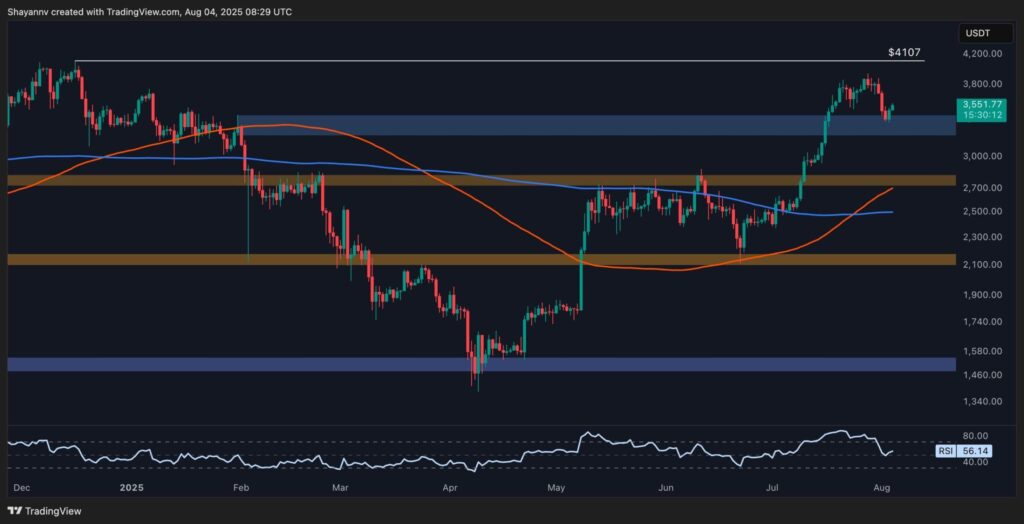
On the daily chart, ETH trades above the upper Bollinger Band, which sits near $4,344. This position often points to strong bullish momentum but can also mean overbought conditions. The bands are wider than earlier in the year, showing higher market volatility.
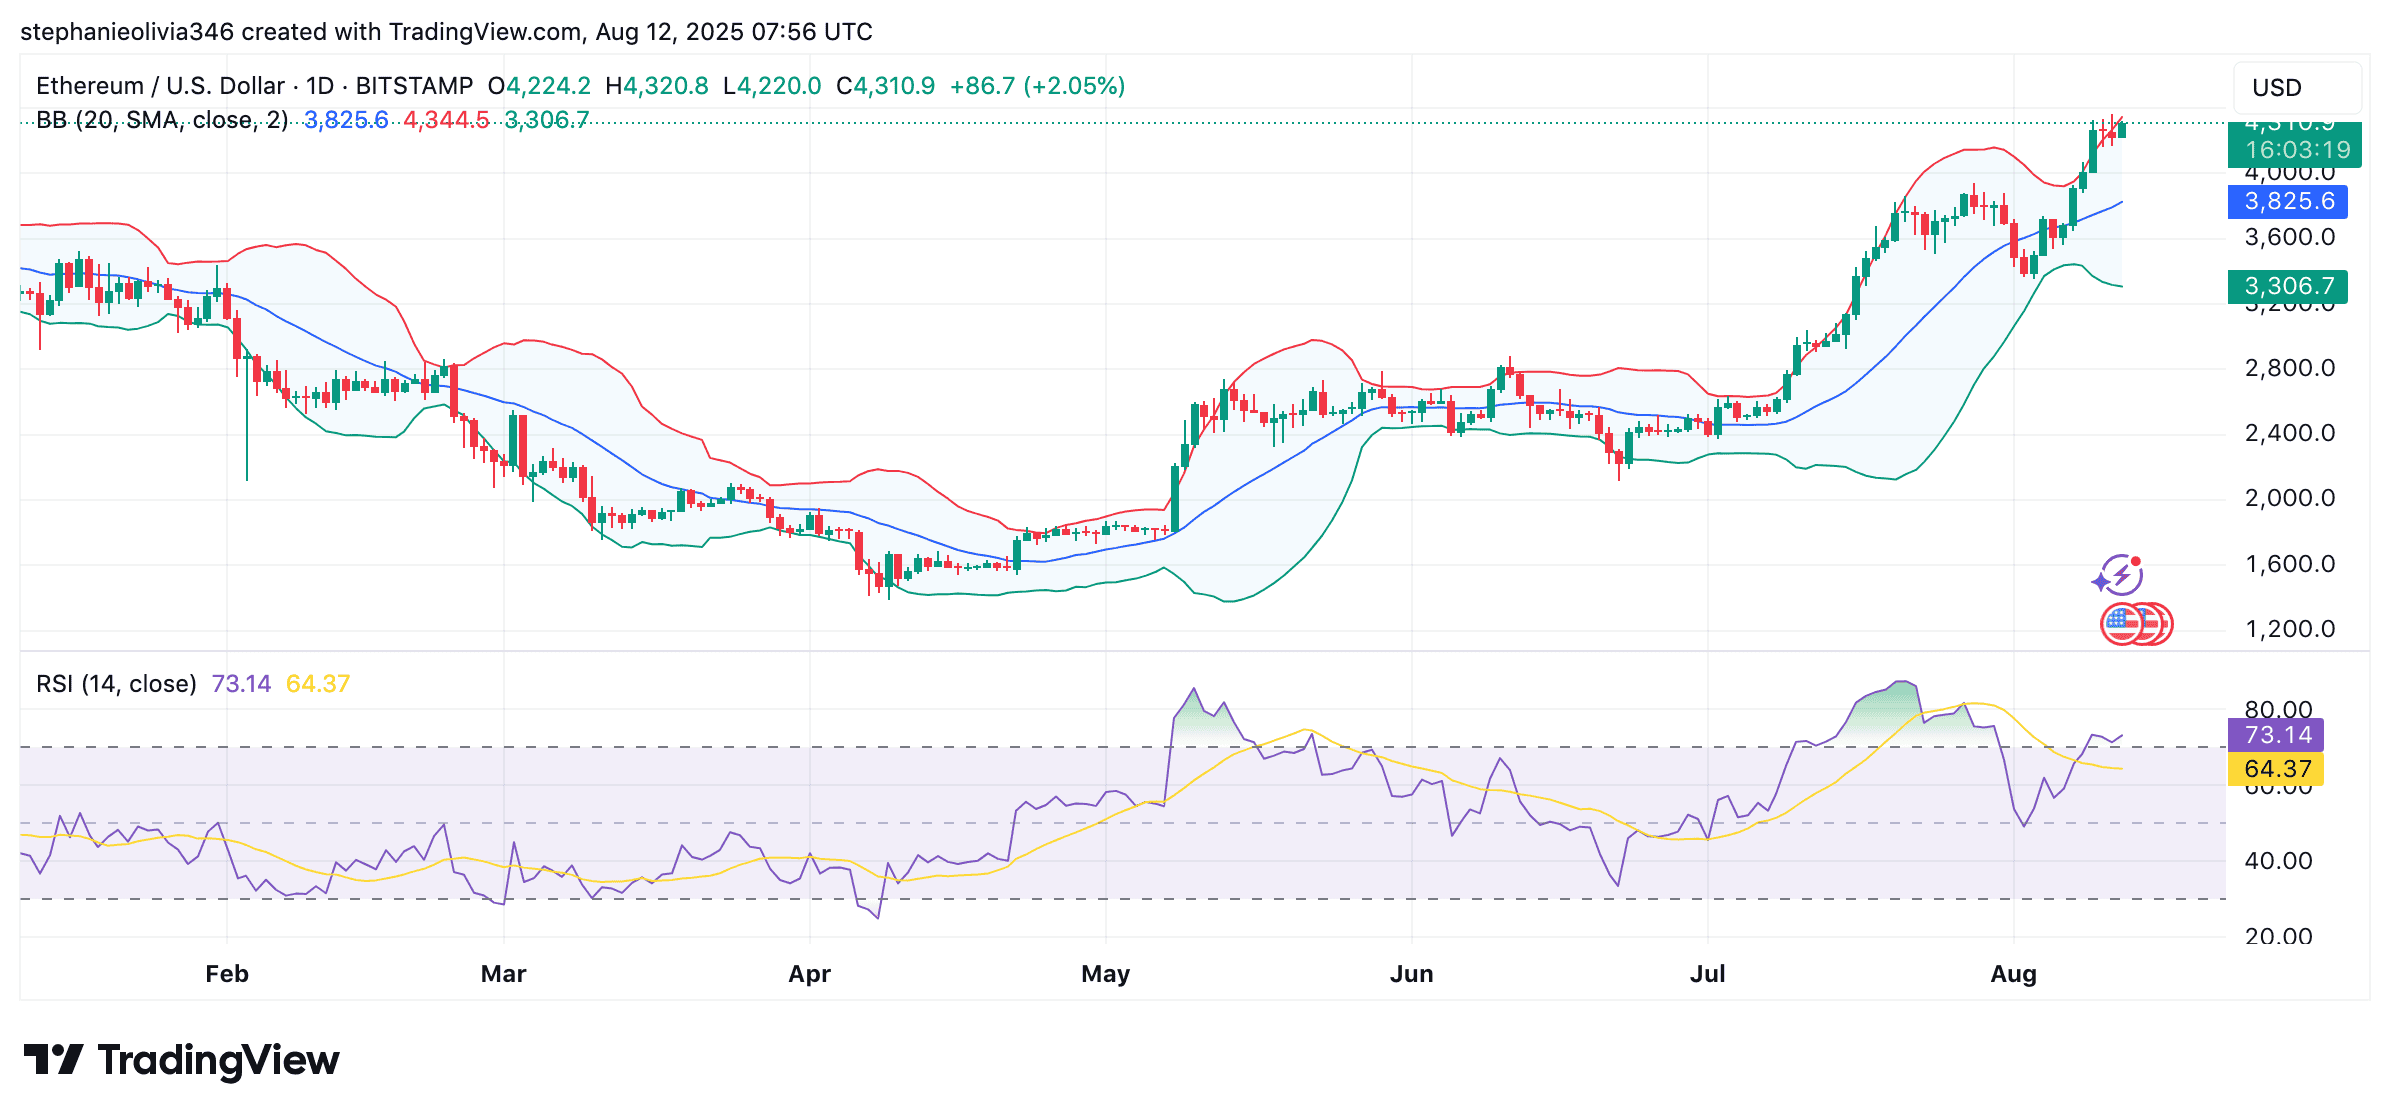
Meanwhile, the 14-period Relative Strength Index (RSI) stands at 73. Readings above 70 can indicate overbought conditions. The RSI has held above 50 since mid-July, showing sustained buying strength.
Analyst ZYN noted,
“This RSI trendline has perfectly marked ETH tops… I think $ETH local top could happen around $4.8K-$5K this time.”
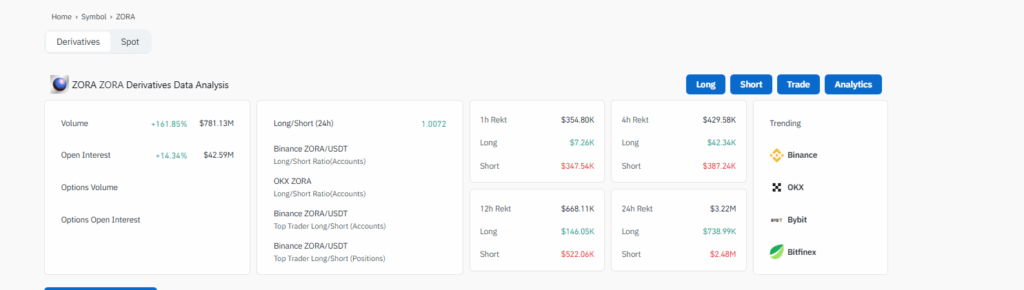
Open interest in ETH derivatives is at $10 billion on Binance, up 46% in 30 days. Short positions have jumped 500% year-on-year and 40% in the past week. Crypto Patel observed that a move above $4,400 could “trigger a short squeeze,” which may drive prices sharply higher.
Ethereum Could Be Headed for a Big Squeeze$ETH back at $4,300, just 12% from ATH.
Binance ETH Open Interest → $10B (+46% in 30d)
Short positions up 500% YoY, +40% this week.30% of supply staked. Exchange reserves near record lows.
ETF inflows > $117B. Whales adding… pic.twitter.com/0nDzVfkVxW— Crypto Patel (@CryptoPatel) August 11, 2025
On-Chain and Market Data
Wallet activity shows large-scale accumulation. Lookonchain reported one entity created 10 new wallets in eight days, buying 312,052 ETH worth about $1.34 billion from major providers such as FalconX, Galaxy Digital, and BitGo. Around 30% of the ETH supply is staked, while exchange reserves are near historic lows.
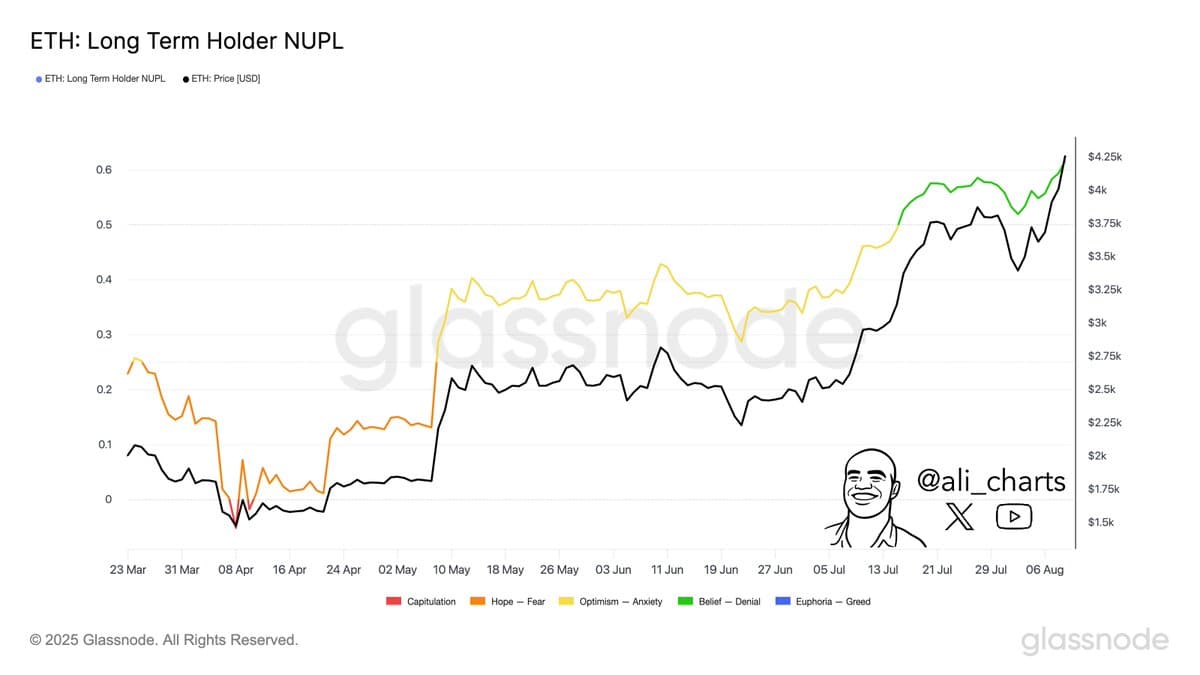
Long-Term Holder Net Unrealized Profit/Loss (NUPL) data from April showed most holders in a loss when ETH was near $1,800. By late July, with ETH over $3,000, the NUPL moved into the “belief” zone, meaning most holders are now in profit.
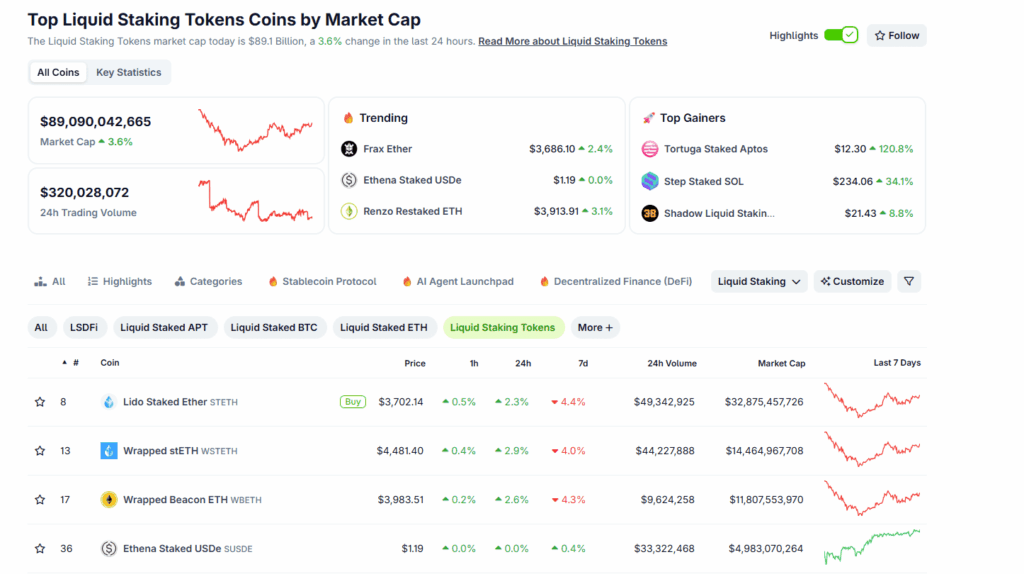
Corporate buying is also strong. BitMine Immersion (BMNR) disclosed holdings of more than 1.15 million ETH, valued at $4.9 billion, making it the largest corporate ETH holder. This is an increase of 317,000 ETH in one week.
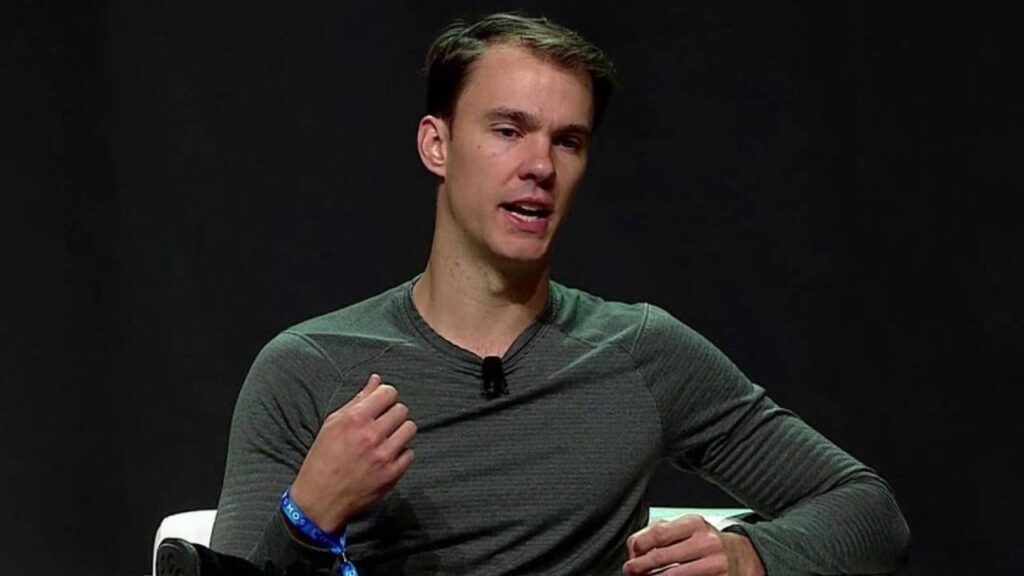
ETF demand remains a key factor. Ether ETFs have drawn more inflows than Bitcoin ETFs, with some analysts saying these products were initially underestimated.
Nate Geraci commented, “Feel like spot eth ETFs were severely underestimated simply [because] tradfi investors didn’t understand eth,” adding that institutions now view Ethereum as the “backbone of future financial markets.”
Broader Market Context
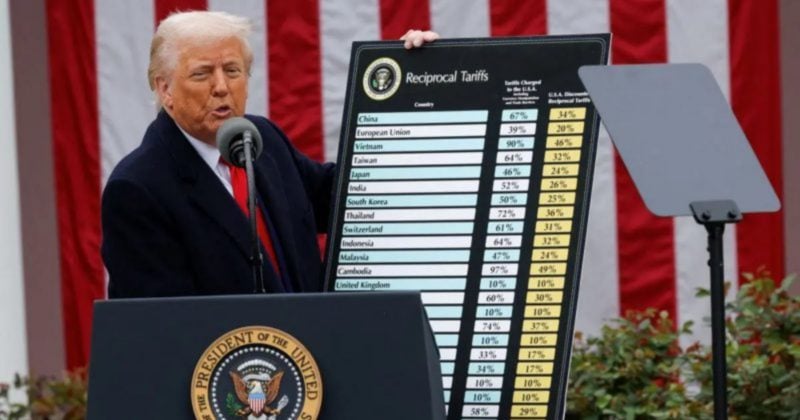
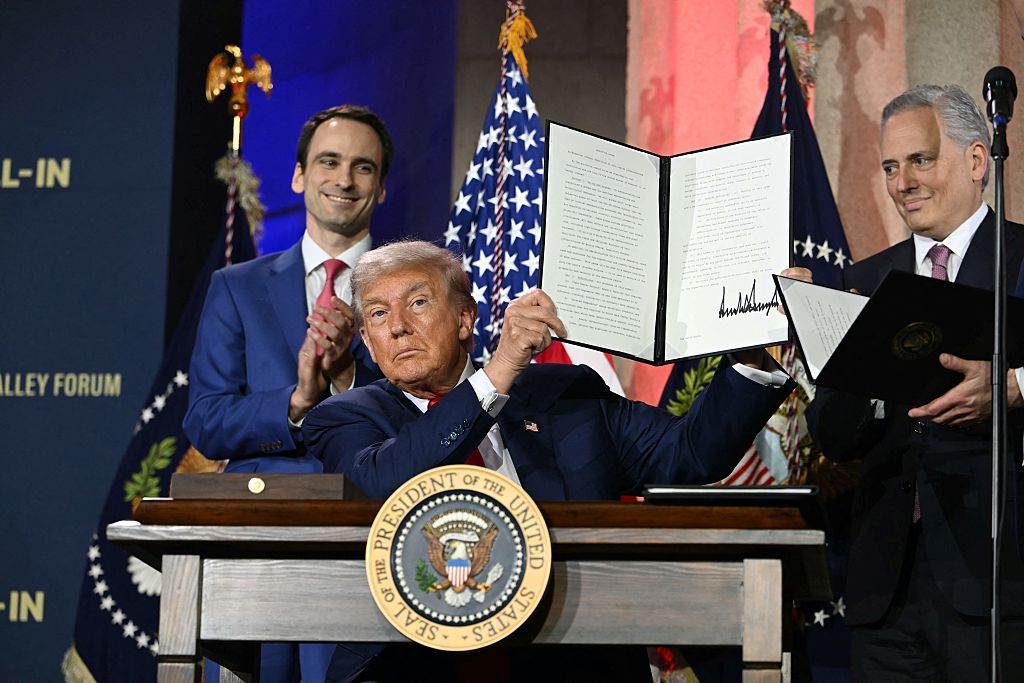
Market sentiment is influenced by expectations of interest rate cuts, looser liquidity rules, and possible inflows from retirement accounts and institutional funds. Commentator Ted pointed to factors including pro-crypto laws, ETF expansion, bank capital changes, and large cash reserves in money markets that could enter the market.
Altcoin market value is approaching a resistance level that led to a 50% drop in late 2024. Ether Wizz said conditions now differ, with more liquidity and stronger momentum in Ethereum and other altcoins, which could support a breakout.
Altcoin MCap has reached a major resistance zone.
In Q4 2024, Altcoin MCap got rejected from this level which resulted in a 50% crash.
But this time, the dynamics are different.$ETH and alts are showing incredible strength, and new liquidity is entering the market.
I guess a… pic.twitter.com/3irVGYFWAz
— Ether Wizz (@EtherWizz_) August 11, 2025
Do ETH Price Predictions Make Sense?
Ethereum price forecasts outline potential future ranges using market trends, technical signals, and blockchain data. They are not assured outcomes.
In fact, the market can change quickly due to global economic shifts, policy moves, or changes in investor behavior. A move to $5K is possible if current momentum holds.
Chart patterns, past RSI readings, and moving averages can provide guidance, but they are most effective when combined with on-chain metrics and trading flow data. No single measure can guarantee results.
How Are Ethereum Price Predictions Made?
Forecasts often combine three main approaches.
Technical analysis examines charts, moving averages, and indicators like RSI to find likely support and resistance levels.
On-chain analysis reviews wallet movements, staking figures, and exchange balances to see how participants are positioning.
Macro analysis considers interest rates, liquidity levels, and institutional adoption.
By combining these, analysts can form a scenario for likely price direction and key levels to watch.
Binance Free $600 (CryptoPotato Exclusive): Use this link to register a new account and receive $600 exclusive welcome offer on Binance (full details).
LIMITED OFFER for CryptoPotato readers at Bybit: Use this link to register and open a $500 FREE position on any coin!