












































































































































































































































































































































































































































































































































































































































































































































































































































































































































































































































































































































































































































































































































































































































































































































































































































































































Ethereum price tests $1,700 as ETF outflows hit $208.5M


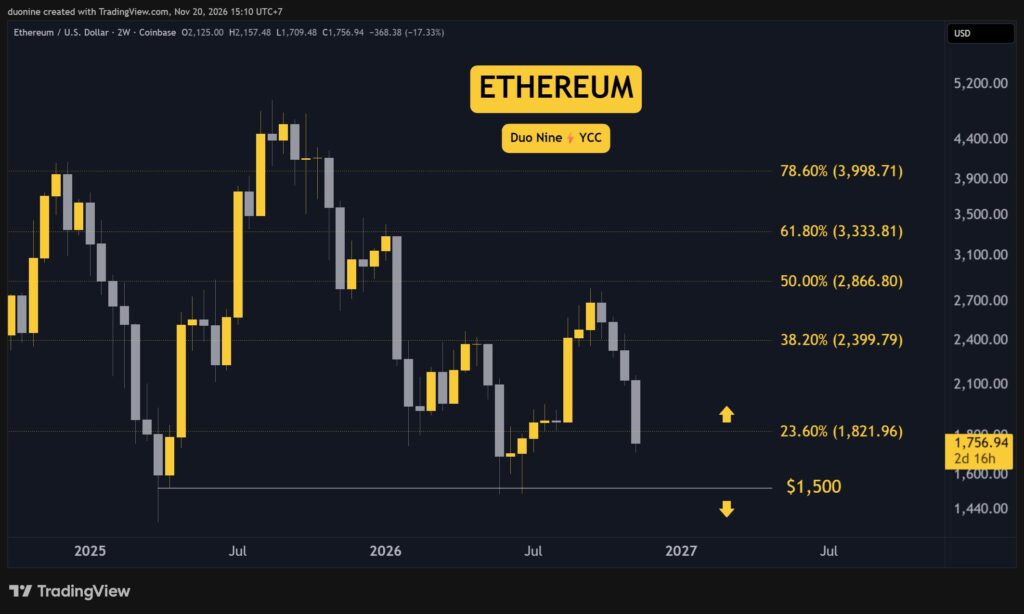
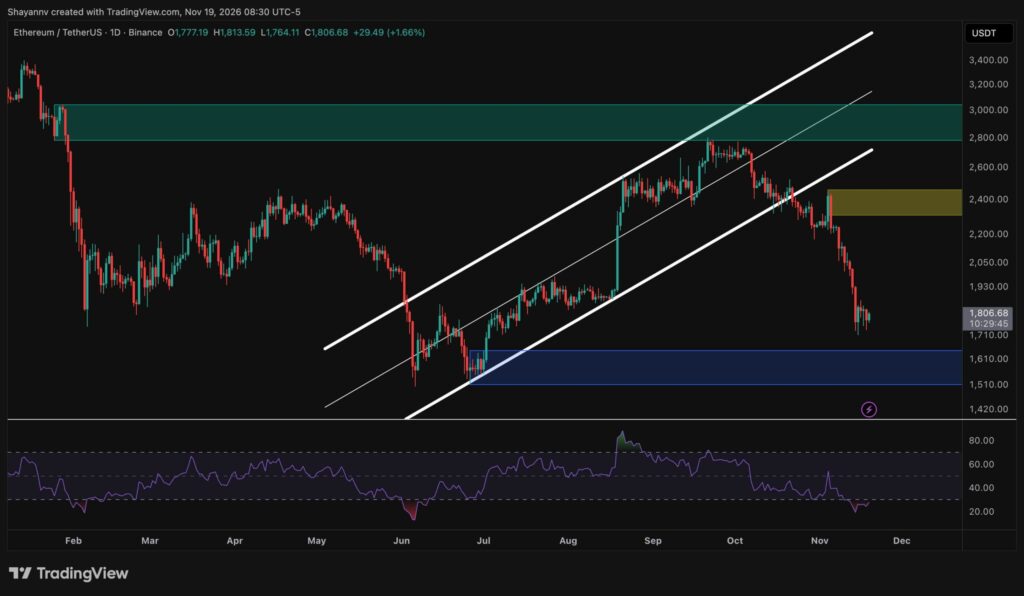
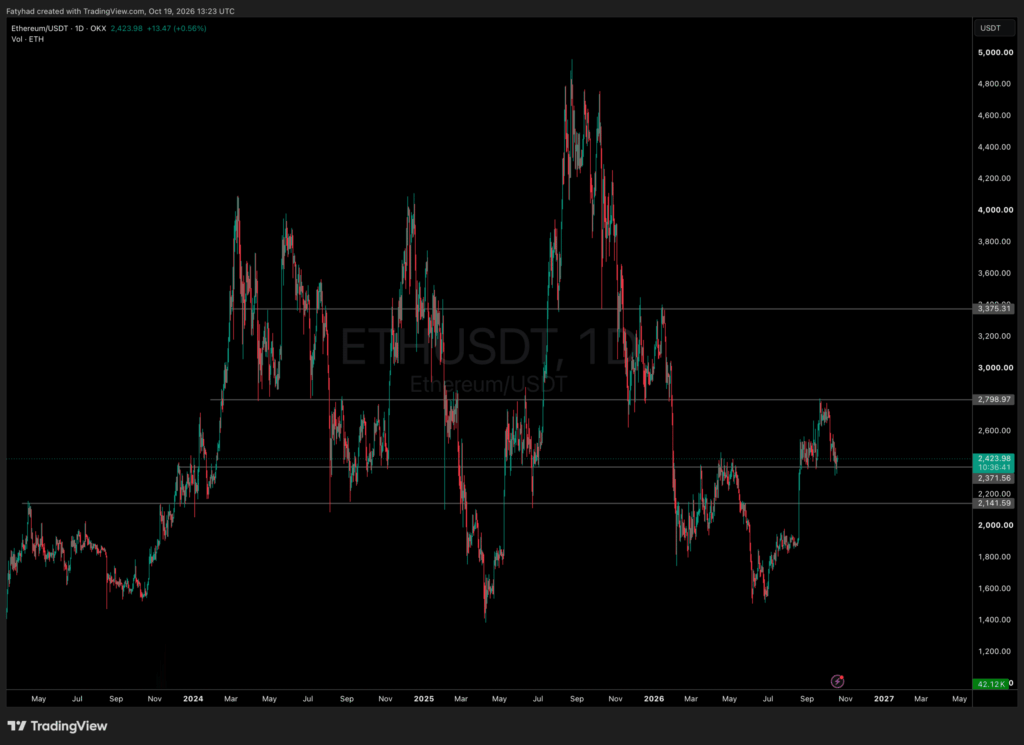
Ethereum has fallen to around $1,735 on Nov. 20, testing support near $1,700 as U.S. spot Ethereum ETFs have recorded $208.5 million in net outflows over four trading sessions.
Summary
- ETH traded as low as $1,717.82 on Friday, putting it back inside the $1,700–$1,750 support zone.
- BlackRock’s ETHA accounted for nearly 95% of Thursday’s $131.2 million in net ETF outflows.
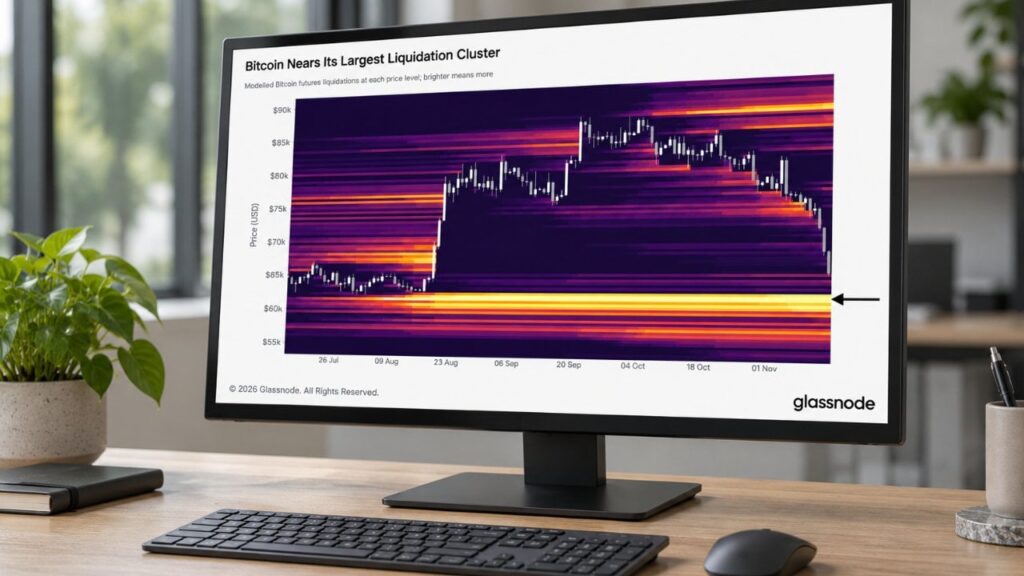
- The CoinGlass heatmap showed its brightest overhead liquidation band near $1,870.
- Ethereum’s daily RSI fell to 22.63, while weekly Chaikin Money Flow hovered just above zero.
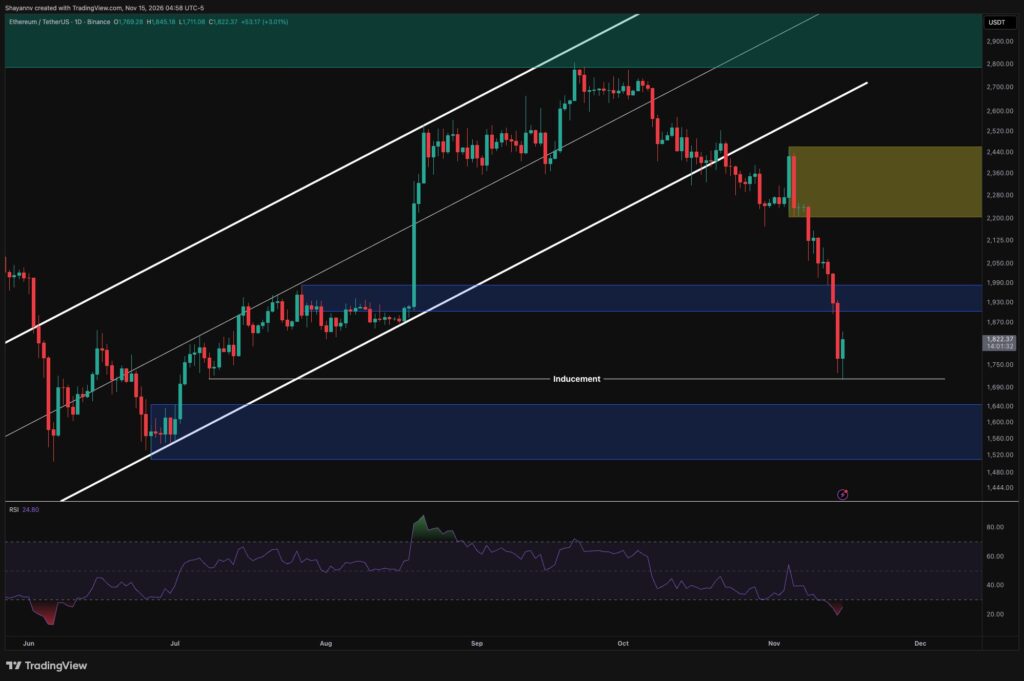
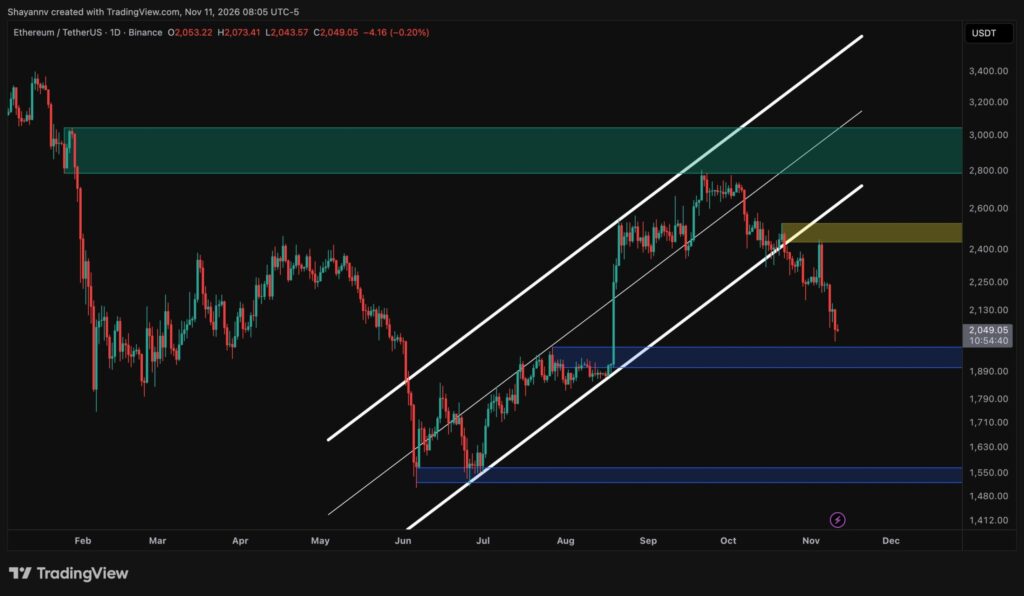
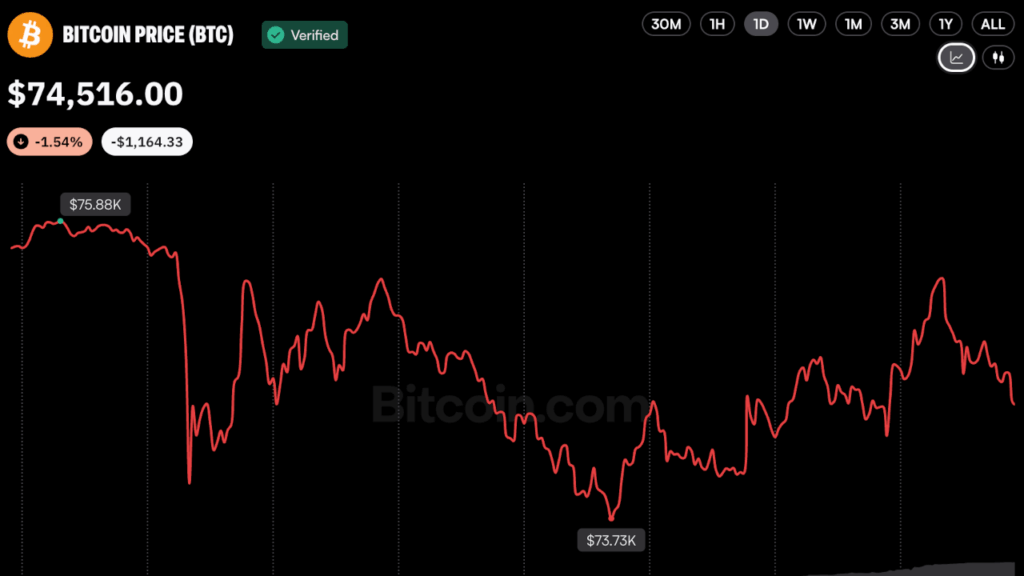
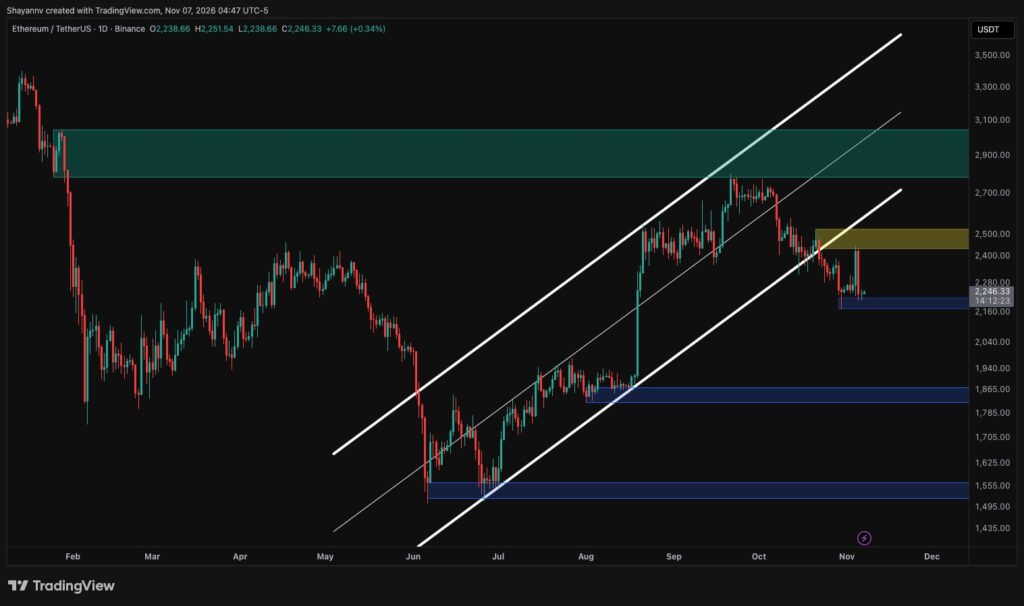
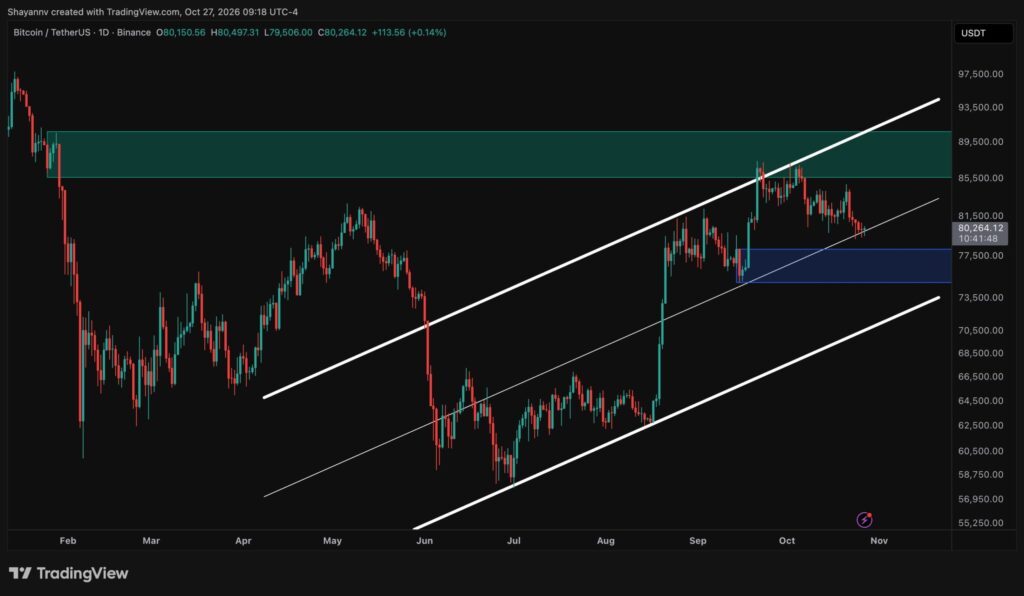
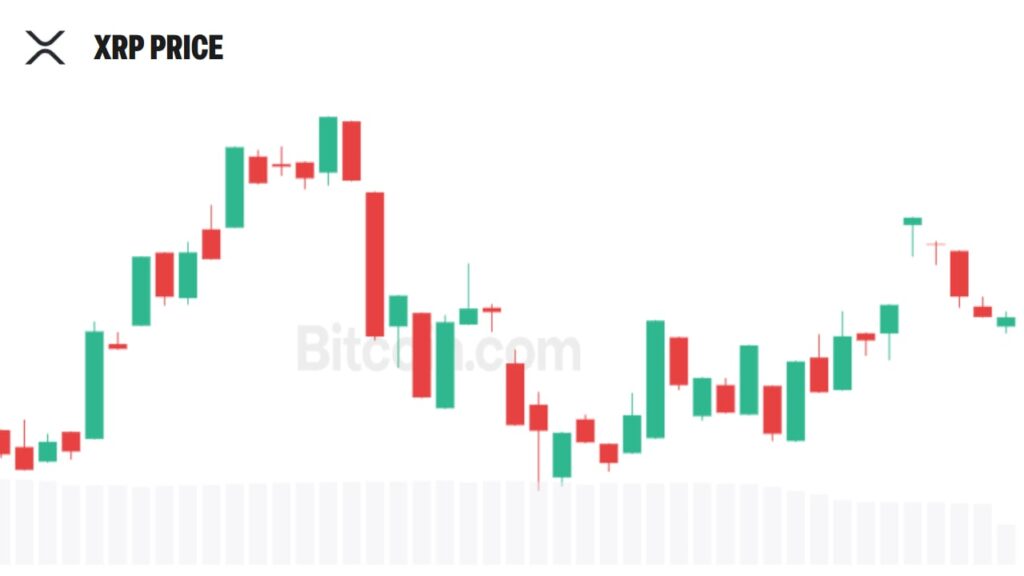
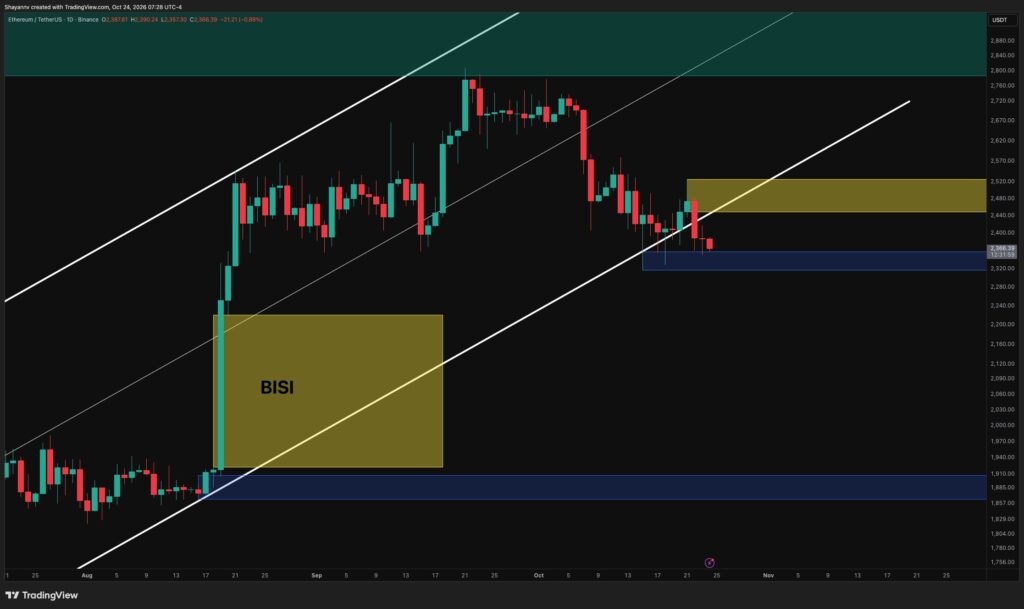
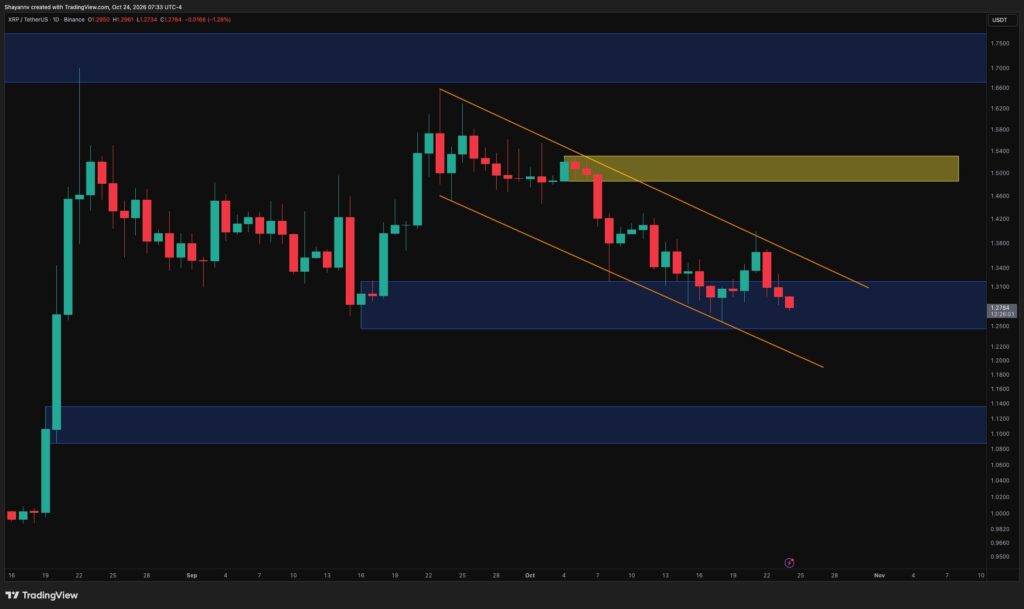
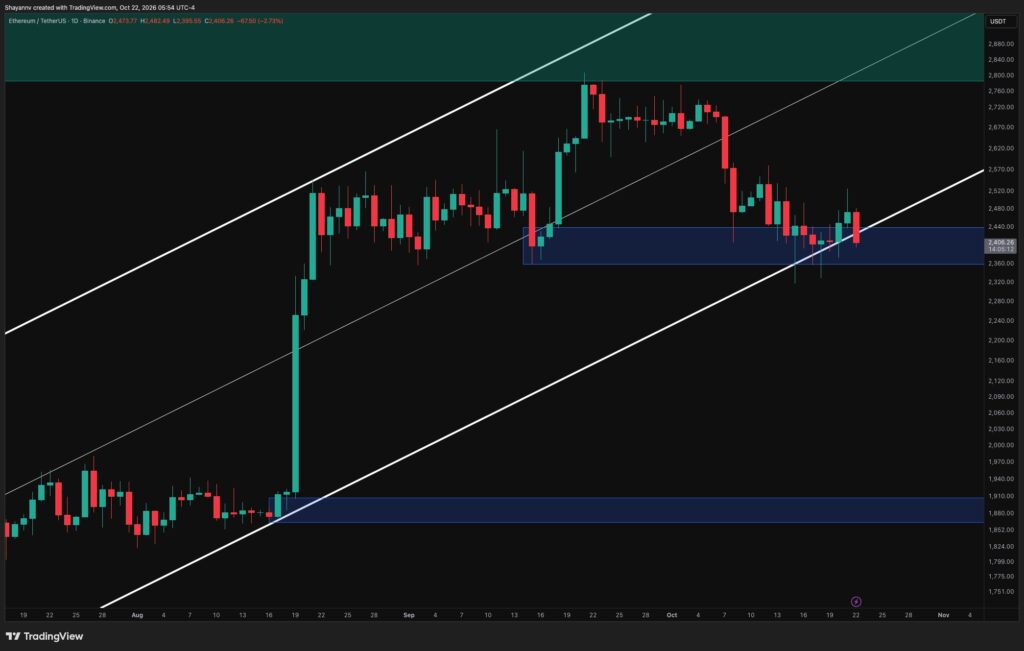
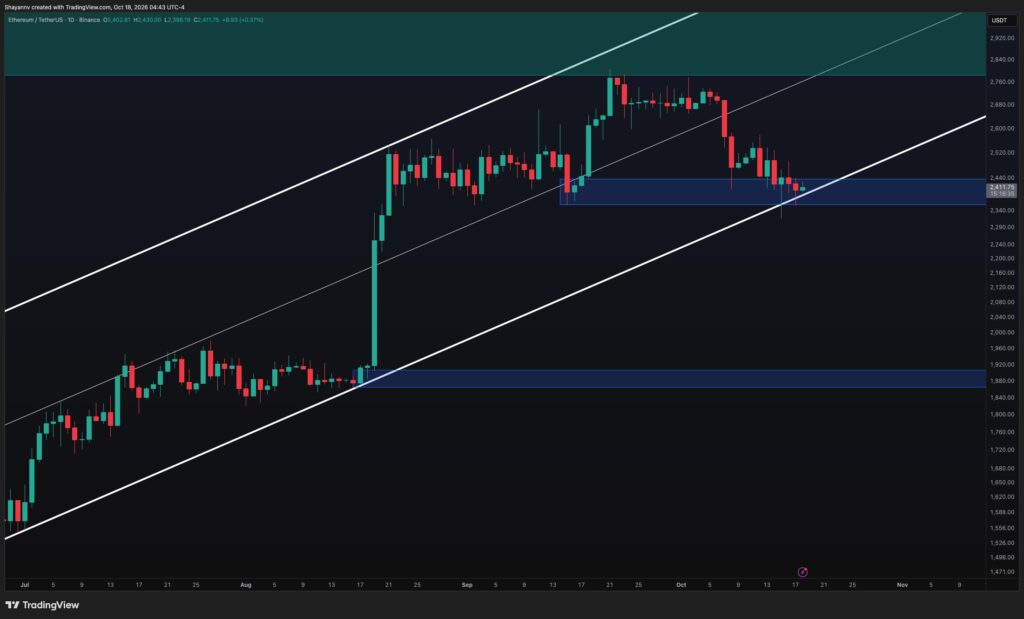
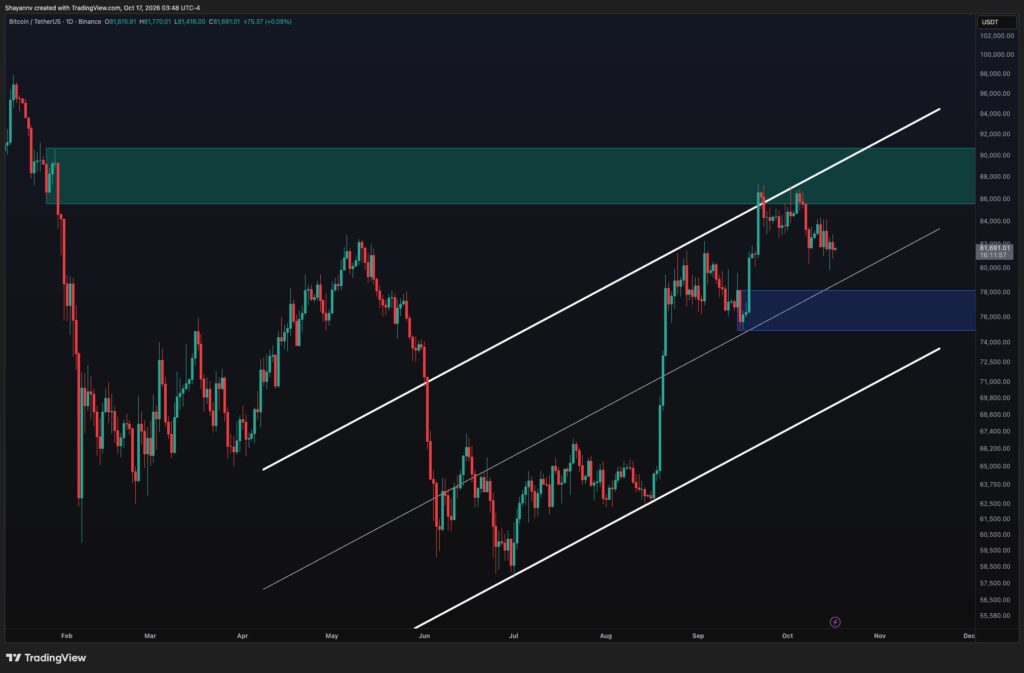
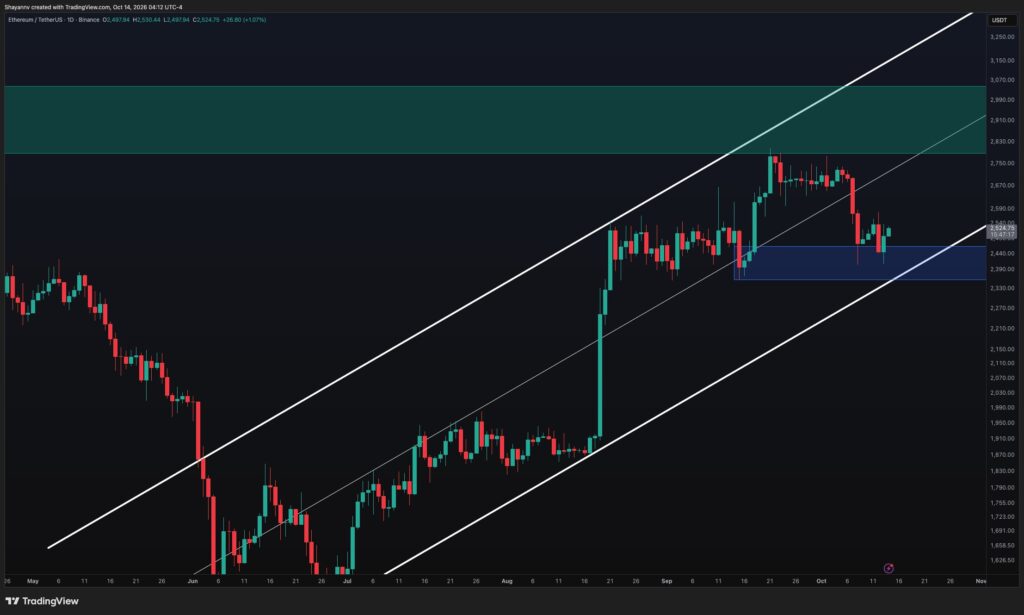
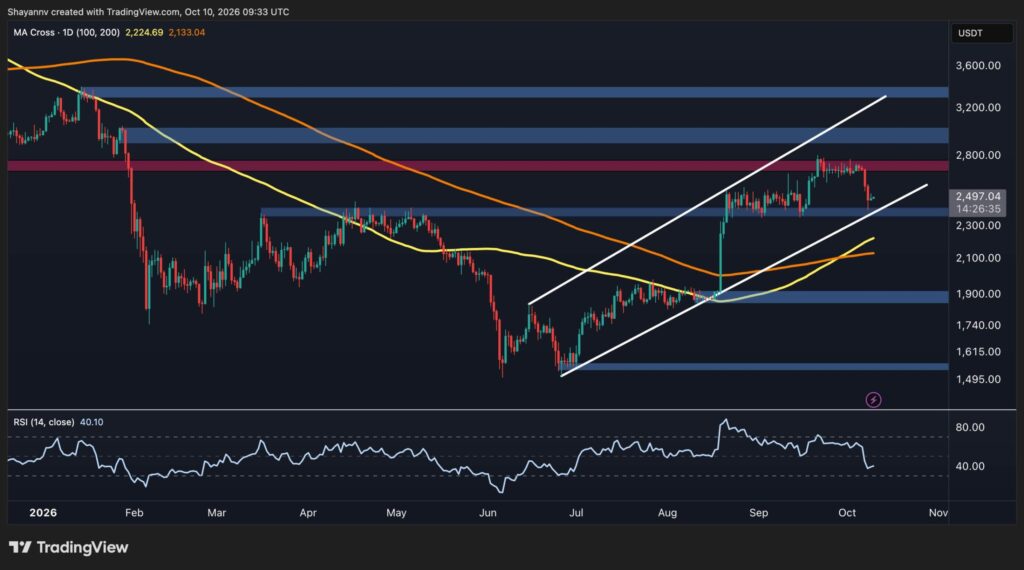
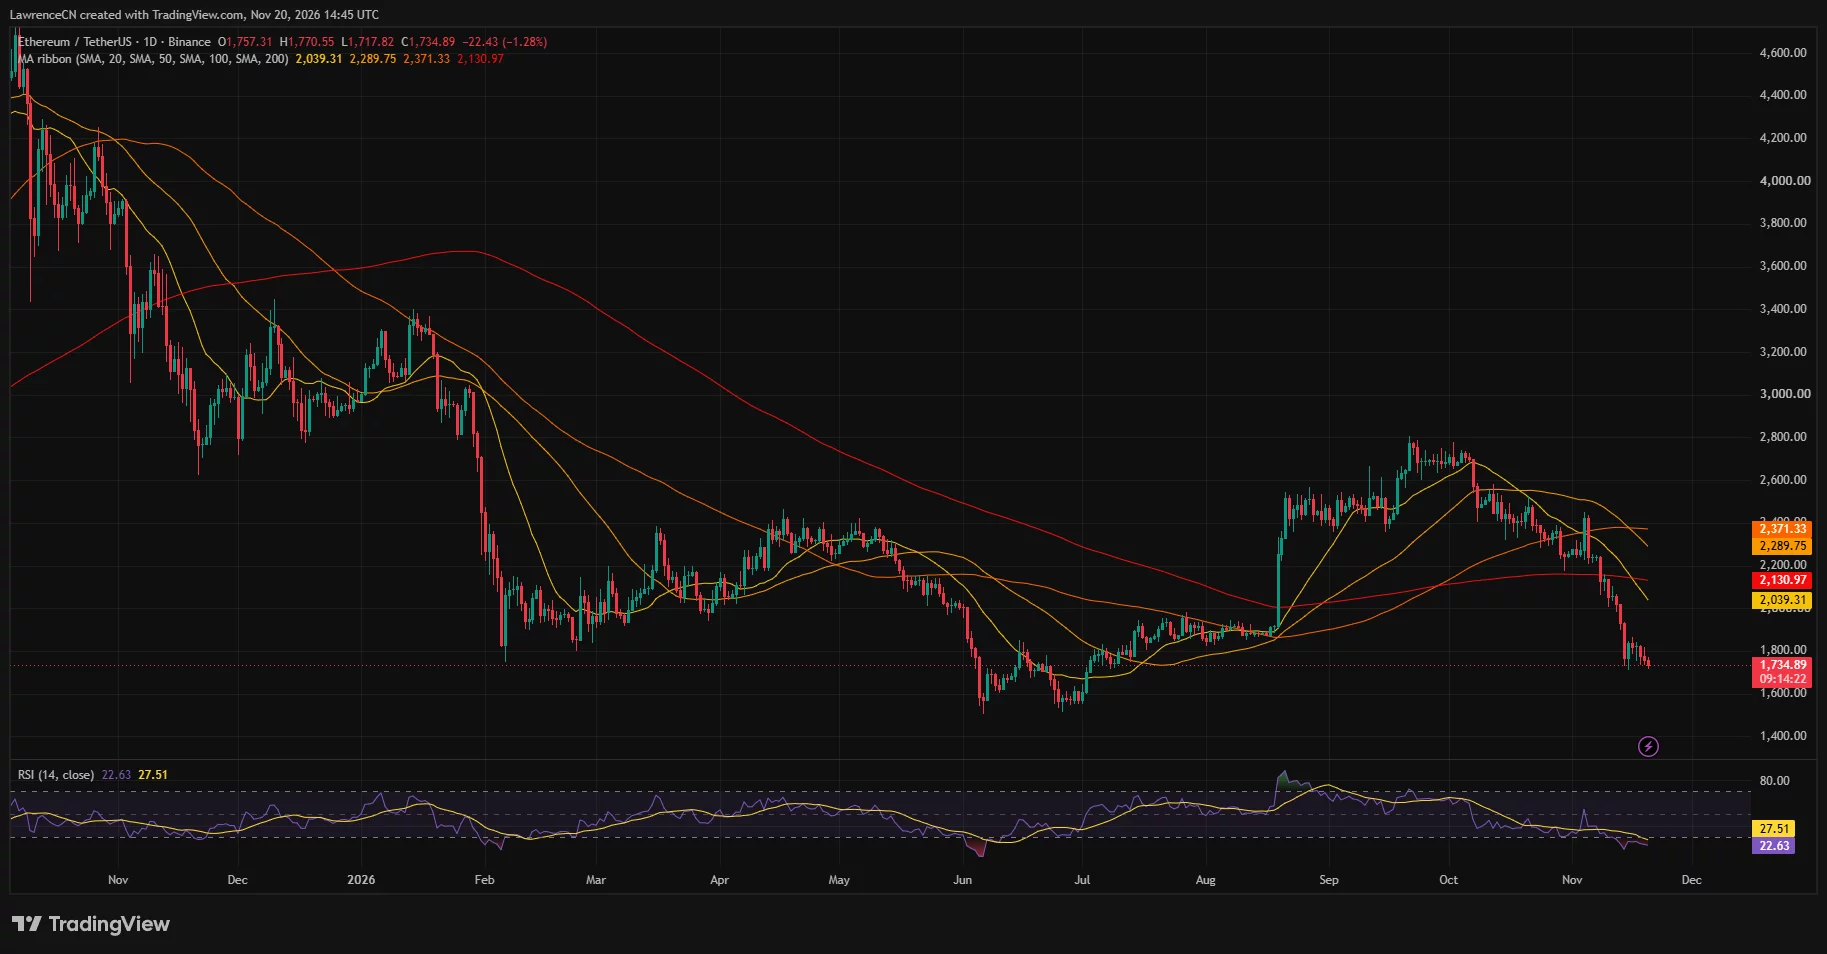
TradingView’s daily Binance ETH/USDT chart showed Ether at $1,734.89 at 14:45 UTC on Friday, down 1.28% from the daily open. The price had already touched $1,717.82 and had yet to trade above $1,770.55 during the session. The price came from the open daily candle, with more than nine hours left in the session.
Ethereum ETF withdrawals accelerate on Thursday
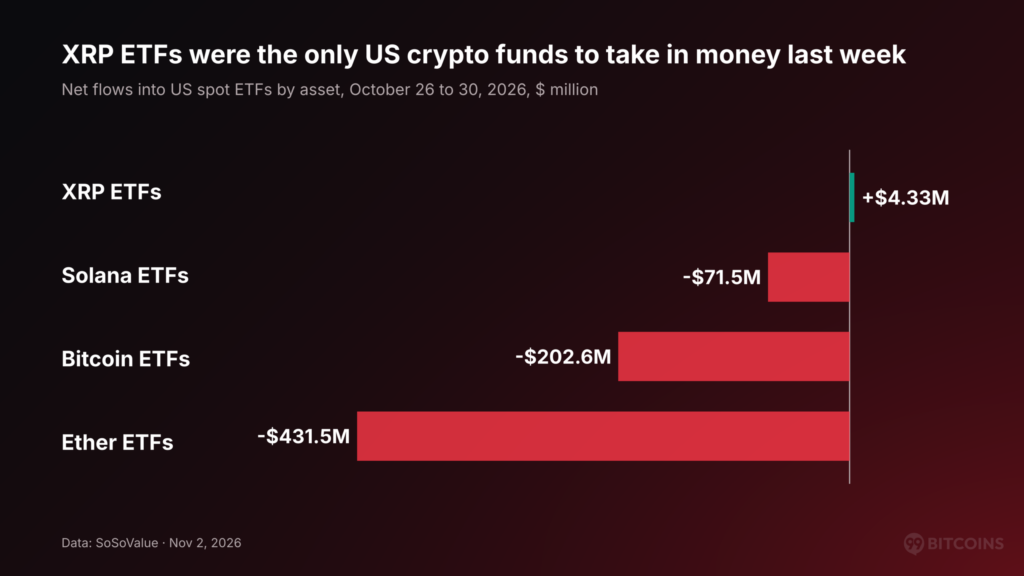
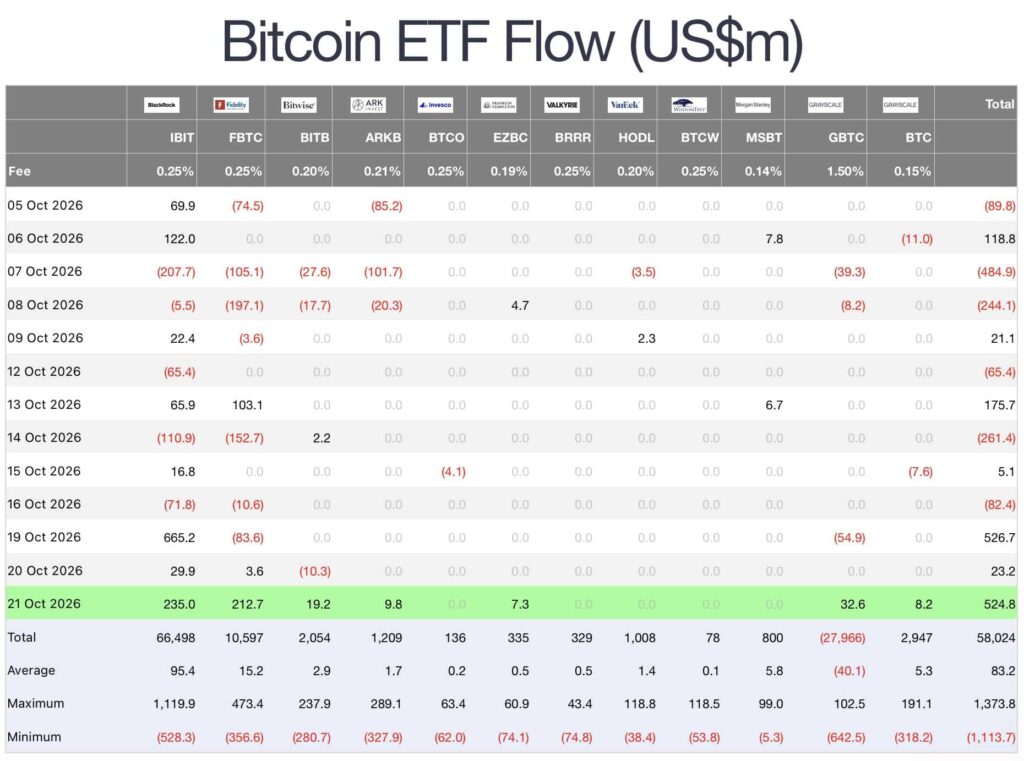
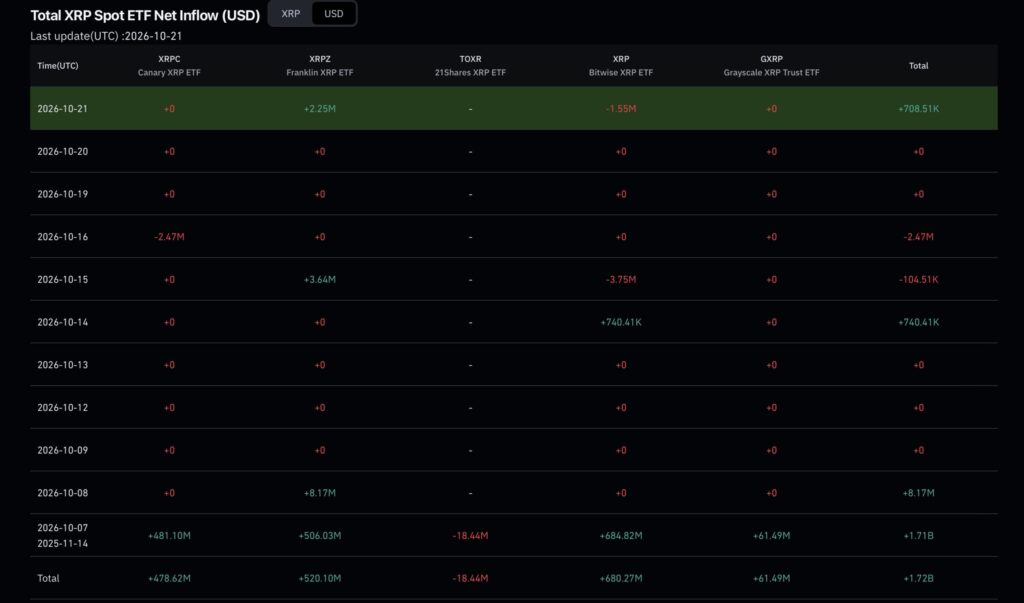
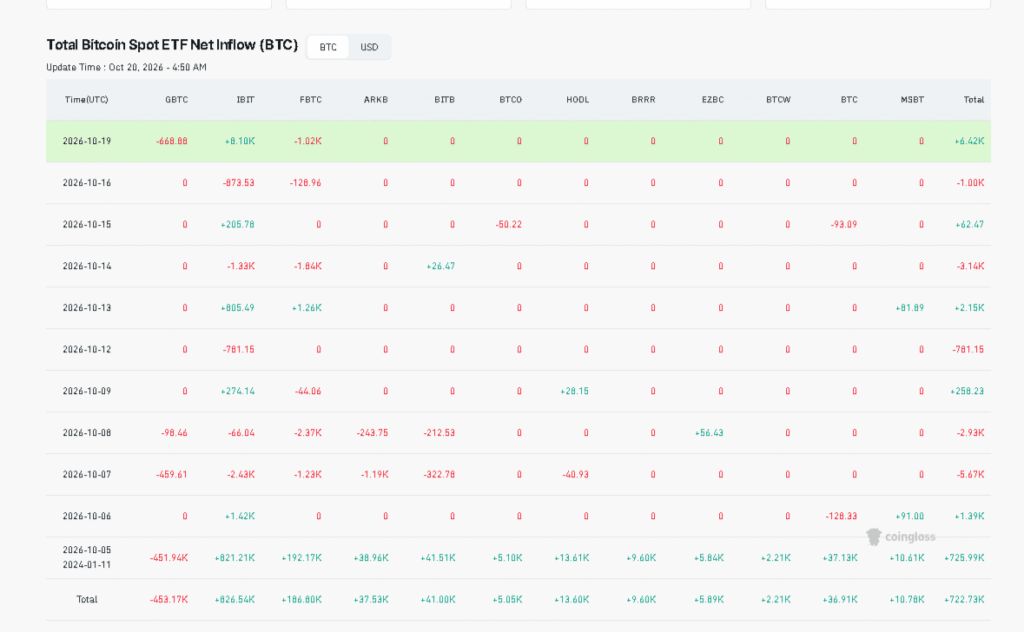
Farside Investors recorded net withdrawals in each of the four U.S. trading sessions from Nov. 16 through Nov. 19. The funds lost $8.4 million on Monday, $29.1 million on Tuesday and $39.8 million on Wednesday before Thursday’s $131.2 million withdrawal. The last session accounted for almost two-thirds of the four-day total.
BlackRock’s iShares Ethereum Trust ETF, which trades as ETHA, recorded $124.2 million in net outflows on Thursday. BlackRock’s staked Ether ETF recorded another $1.8 million in withdrawals, while Grayscale’s Ethereum Trust shed $5.2 million.
Across November through Thursday, the funds had recorded $972.6 million in net outflows, according to Farside figures tallied in earlier coverage. The latest four sessions accounted for just over a fifth of that month-to-date total.
The funds had briefly returned to net inflows the previous Friday. Fidelity’s Ethereum fund brought in $11.6 million on Nov. 13, enough to offset $9.3 million in withdrawals from Grayscale’s Ethereum Mini Trust. Even with that positive session, the group ended the Nov. 9–13 trading week with $398.9 million in withdrawals.
The U.S. Securities and Exchange Commission permitted in-kind redemptions for spot Ether products in July 2025. Where funds use that option, an authorized participant can receive Ether in exchange for shares. The flow figures track net money entering or leaving the products, while any subsequent sale of Ether received through an in-kind redemption is a separate trade.
Ether revisits the $1,700–$1,750 support zone
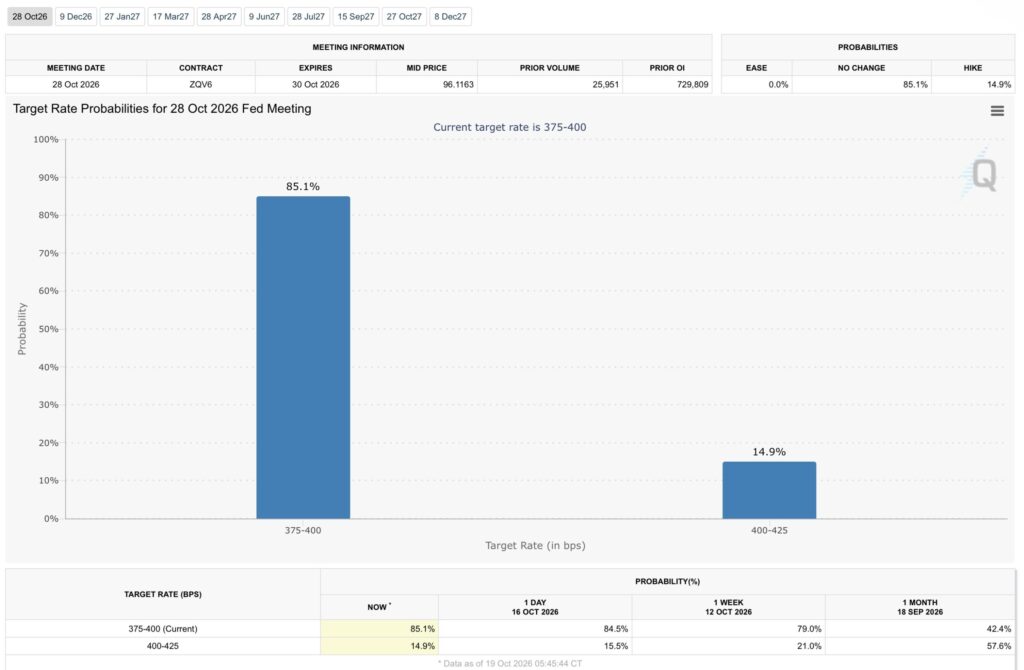
Ether was already trading below $2,000 on Nov. 13, when crypto.news reported nearly $250 million in liquidated ETH positions. The move came during a week in which the Bureau of Labor Statistics reported a 0.4% monthly rise in consumer prices. The agency’s producer-price report put October wholesale inflation at 6.5% year over year, even as the monthly rise slowed to 0.3%.
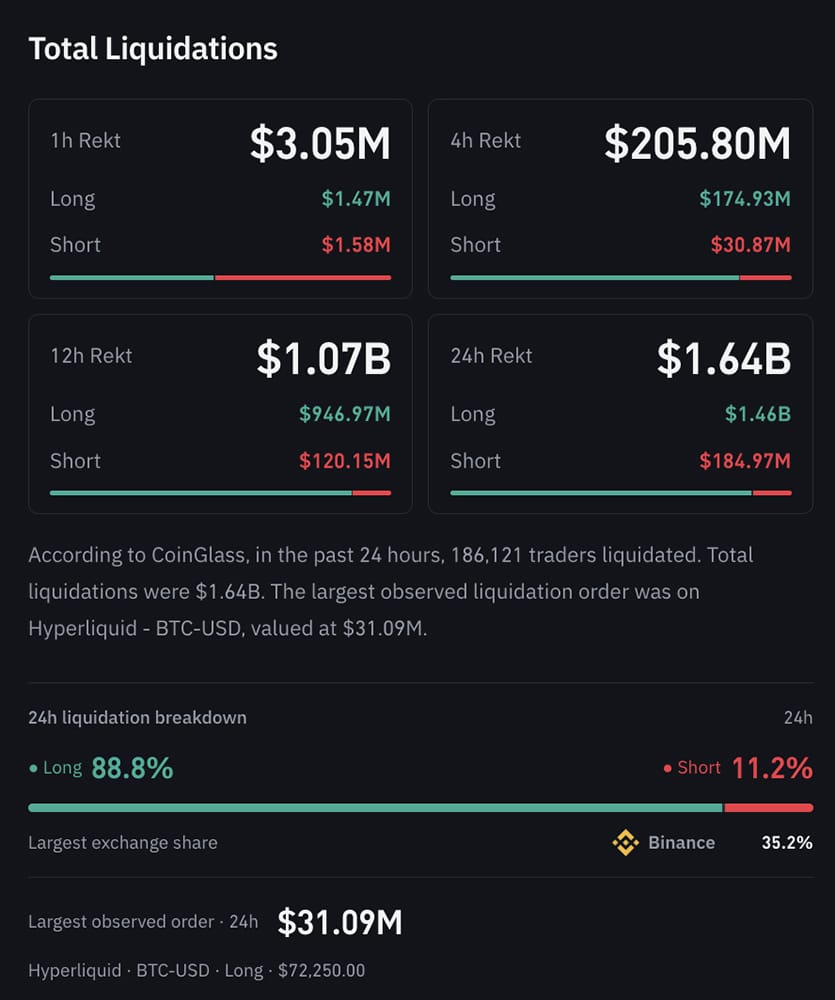
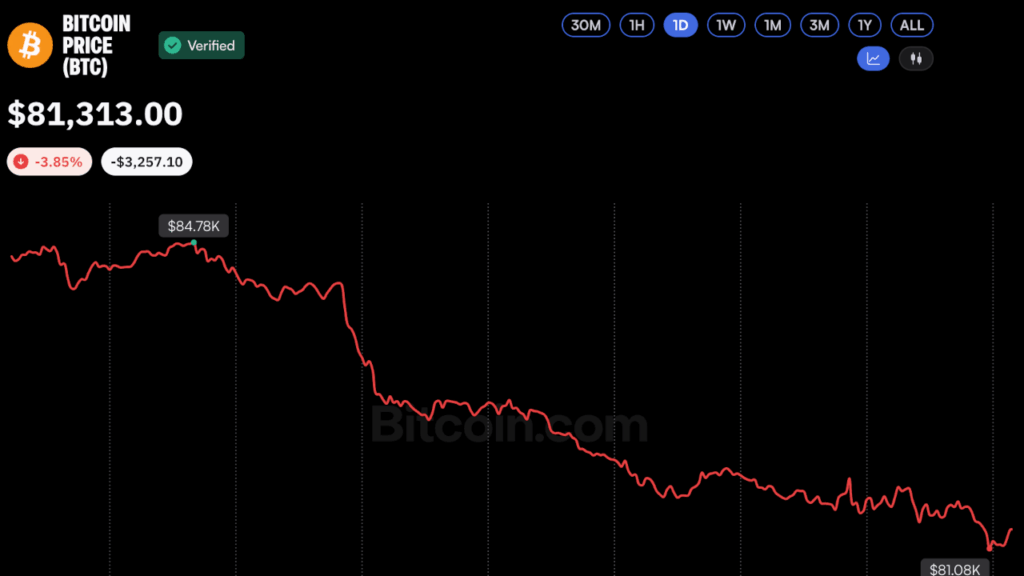
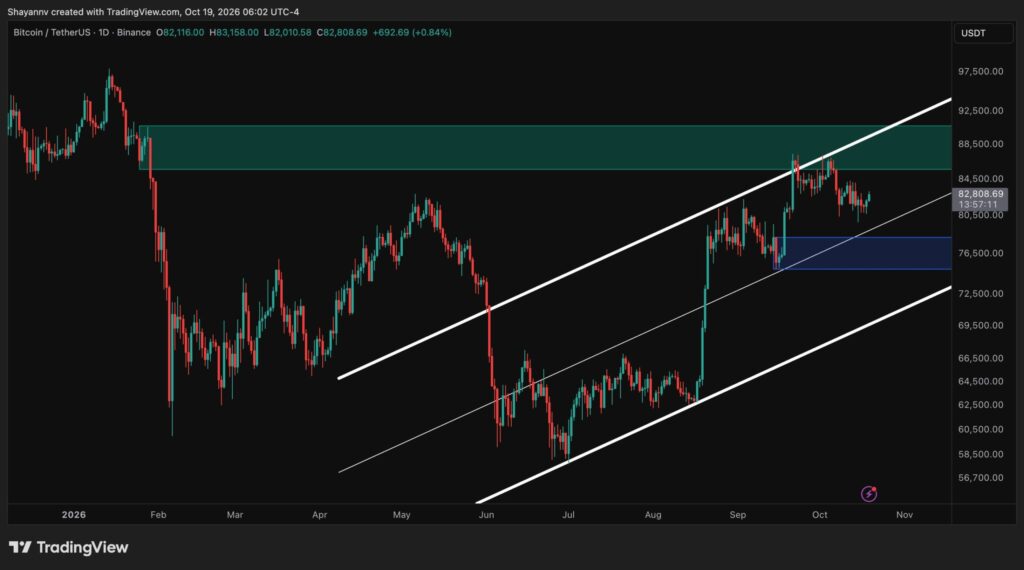
The sell-off carried into the weekend. By Nov. 15, CoinGlass data showed nearly $2 billion liquidated across crypto in a 24-hour period, including roughly $750 million in Bitcoin positions. Long positions accounted for nearly 80% of the Bitcoin total.
On Friday, market commentator Ted Pillows wrote on X that Ether had returned to the $1,700–$1,750 support area. He warned that losing it could send the token to fresh lows. Ethereum last traded near $1,500 in June, when it hit a yearly low of $1,506.50, according to historical CoinGlass data cited in earlier coverage.
The same data put Ether’s September close near $2,684, before it fell more than 16% in October to finish the month at $2,252.70.
The daily chart put ETH below all four moving averages it tracked. The 20-day average had dropped to $2,039, below the 200-day average near $2,131, while the 50-day average still sat higher at roughly $2,290. The 14-day relative strength index was 22.63, below the 30 level commonly used to identify oversold conditions.
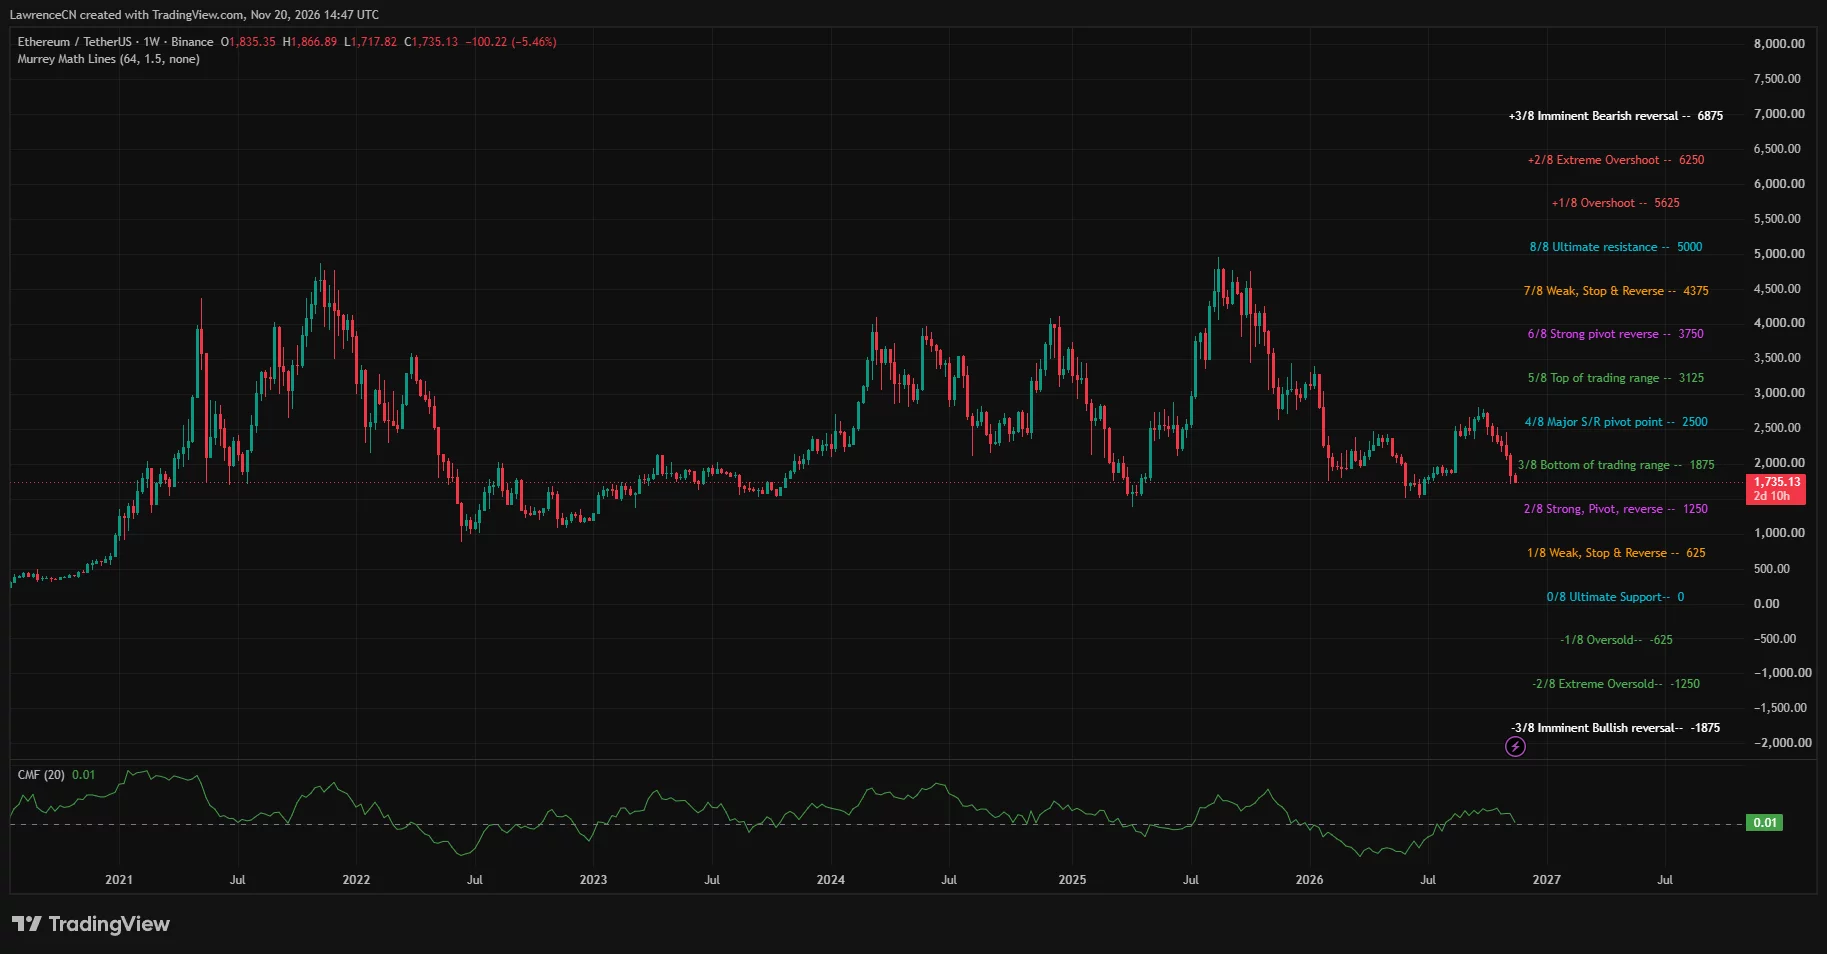
On the weekly chart, Ether had slipped 5.46% from the candle’s $1,835.35 open. Its high of $1,866.89 sat just below the $1,875 level that the Murrey Math indicator identifies as the bottom of its trading range. Weekly Chaikin Money Flow, a price-and-volume gauge of buying and selling pressure, stood at 0.01, close to its zero line.
Liquidation bands build near $1,870
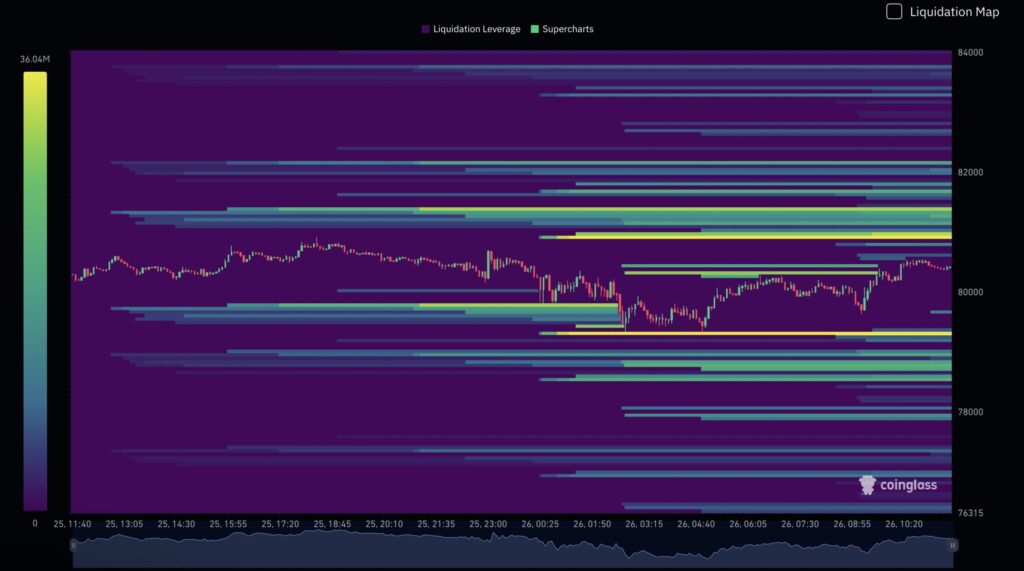
CoinGlass’s seven-day liquidation heatmap put ETH at $1,734, with its brightest band above the market around $1,868–$1,870. Other concentrations appeared between $1,820 and $1,850. Below spot, the map showed bands around $1,715–$1,720 and near $1,700, where a move lower could force more leveraged long positions to close.
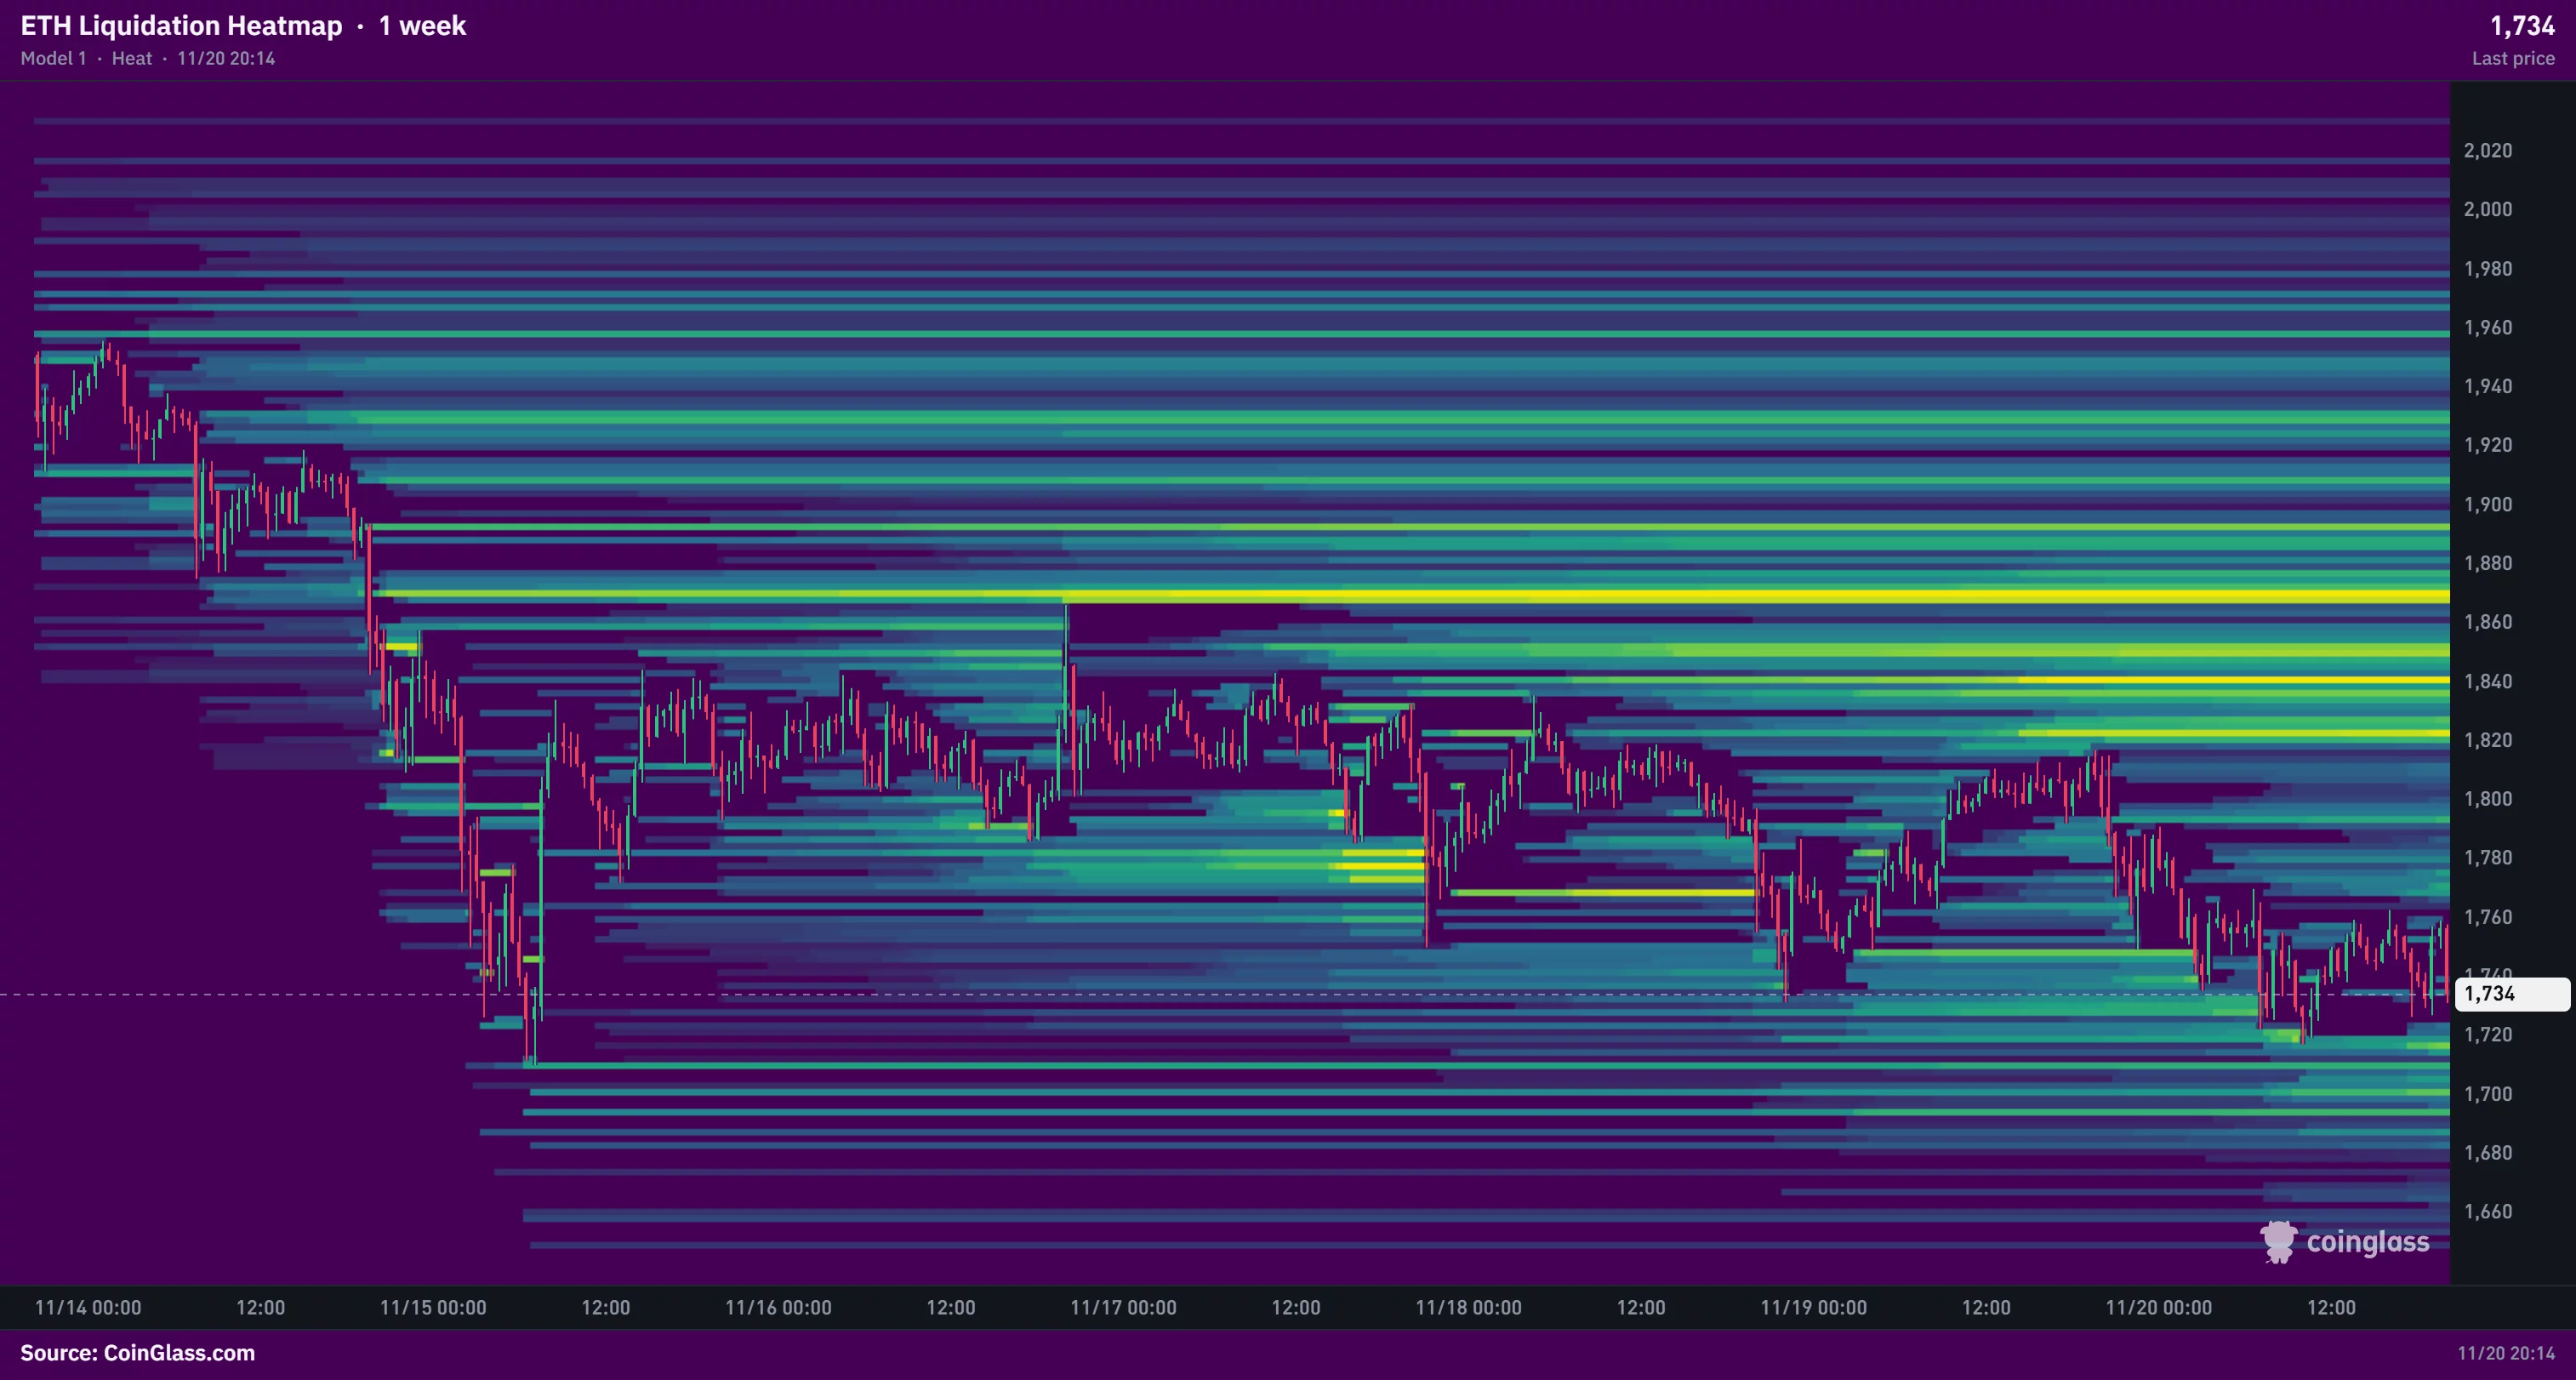
The heatmap estimates where leveraged trades could be closed if prices cross certain levels. A move into the upper bands could put short positions under pressure, while the cash market would still have to trade back through the week’s high to reach the brightest band.
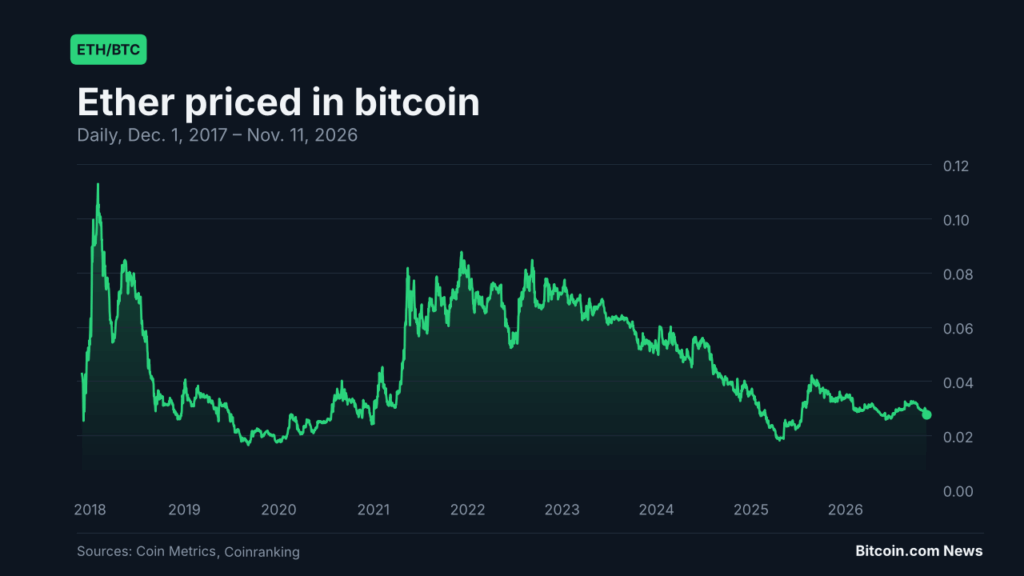
On X, crypto analyst Michaël van de Poppe pointed to a steadier ETH/BTC pair on Friday even as Ether fell in dollar terms. “Another day passes by, and $ETH is not moving at all against Bitcoin,” he wrote, adding that he expected further weakness in altcoins.
Disclosure: This article does not represent investment advice. The content and materials featured on this page are for educational purposes only.